You have /5 articles left.
Sign up for a free account or log in.
Photo illustration by Justin Morrison/Inside Higher Ed | dulezidar/iStock/Getty Images
There are good reasons why the average grade for a freshman in a social science class in 1997 is more than one full letter grade lower than the average grade for a senior in an art class in 2020, but it just doesn’t seem right. Nor does it seem right that the average student in an art class is earning a half a letter grade higher now than in 1997.
It doesn’t seem right because grades are supposed to mean something predictable about mastery or performance, but grades are instead predictable absent any knowledge of a specific student. My goal in this essay is to use a large data set of grades to highlight the problems of our current grading practices, attempt to discern why these problems exist and make a call to action to every college professor to think a bit harder before designing their syllabus and defining the meaning of a grade.
First, join me in imagining a world where grading is ideal. This is a place where an instructor can precisely discern a student’s level of mastery of the material and stamp that degree of mastery with a symbol, whether number, letter or otherwise. Others would be able to look at the grade and know something about the student’s knowledge of the subject. The idea of mastery would be transferable across disciplines: excellence would be discernible from good, mediocre or failing.
Clearly, though, grading is not ideal, and what grades mean is becoming more opaque. The phenomenon of grade inflation has long been known, but nothing seems to have changed.
To explore how grades have changed over time and what factors predict grades, I obtained a data set with all grades from all courses from the 1996–97 academic year through the year 2020 at a single institution. The data set comes from a selective liberal arts college in the Midwest (this was approved by the Institutional Review Board, and no student names or traceable identifiers were included with the data). The college has chosen to remain anonymous but granted permission for this publication. What I saw in the data has forever transformed my approach to grades and grading and made me reflect much more on the philosophy of the entire academic enterprise.
Here’s what I found: The best predictor of an individual’s grade in any class was their grades in other classes. The mean grade of a student is negatively correlated with the variance in the student’s grades, such that the better-performing students tend to be consistently better performing across all subjects. But next in predictive power—greater than the subject of the class, the student’s year in college or the size of the class—was the calendar year. With metronome-like consistency, grades have been increasing. No one has been telling anyone to increase grades, and faculty usually don’t set out to increase grades each semester, but it happens nonetheless.
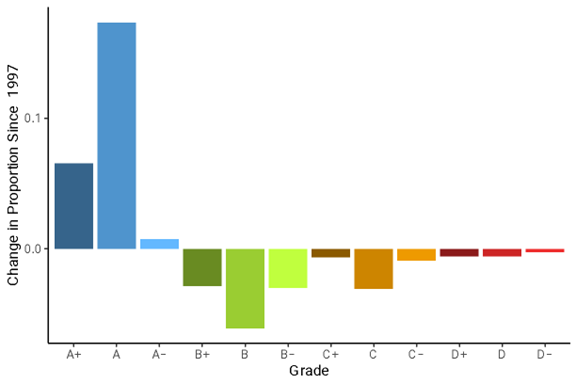
Changes in the proportions of letter grades given across all academic classes between the 1996–97 and 2019–20 academic years at a Midwestern liberal arts college.
Chris Smith
Higher education is fast approaching a wall when all students get A’s in all classes. The wall is when there is no variance in grades at all; every grade is an A (or A-plus) and all students have a 4.0 cumulative GPA.
An A is already the most common grade at the selective Midwestern liberal arts college. Between 1997 and 2020, student grades increased at more than 0.01 grade points per year, rising to an average grade of more than 3.4 (between a B-plus and A-minus). Despite this, it will still take a long time to completely smash the distribution into the wall (i.e., no grade variance, no distribution). At this rate, the average grade will be 3.7 by 2037 and 3.99 by 2080.
At this selective Midwestern college, A grades have increased by 24 percent since the 1996–97 academic year at the relative expense of all other letter grades. With a narrowing distribution, grades become less meaningful and academic differences among students are more difficult to discern.
Another good predictor of grades discernible in this data set is class size. The influence of class size on student learning has long been known, has been empirically demonstrated in large-scale studies and is intuitive to anyone who has stepped into a classroom. Smaller is better.
However, this data suggests that the association between grades and class size is not just about better teaching. First, as predicted, the relationship between class size and grades is negative: The average grade decreases by roughly 10 percent of a letter grade for every doubling in class size (the relationship is exponential, not linear). Second, grade variance is also predicted by class size: The standard deviation of class grades decreases by 5 percent of a letter grade for every doubling in class size. In aggregate, class size explains in excess of 97 percent of the variation in mean grade or grade standard deviation.
Classes with more students tend to have more formalized mechanisms of assessment, and these increase consistency between faculty teaching the same course, as well as between semesters. Assessment also tends to be more objective to facilitate grading a larger population of students (e.g., multiple-choice exams versus essays). The result is more consistent—and lower—grades in larger classes. And class size is itself correlated with other factors, such as the academic discipline of the class, as well as the class level (lower or upper level), that are relevant to this discussion.
I found that the degree of grade inflation over time is remarkably consistent across academic disciplines, but average grades differ predictably among them. If grades really reflected mastery of a subject or coursework, then you would not expect them to differ predictably among disciplines: excellence in painting, philosophy and chemistry are probably equally rare or common. Yet grades are highest in the arts and humanities and lowest in the natural and social sciences—and this has been the case for the entire time span of this data set. All are increasing at the same rate despite differences in course types (studios versus seminars versus labs, etc.), typical assignments (portfolios, essays, reports, etc.) and even what might be considered the qualities that make for the ideal student in any given discipline.
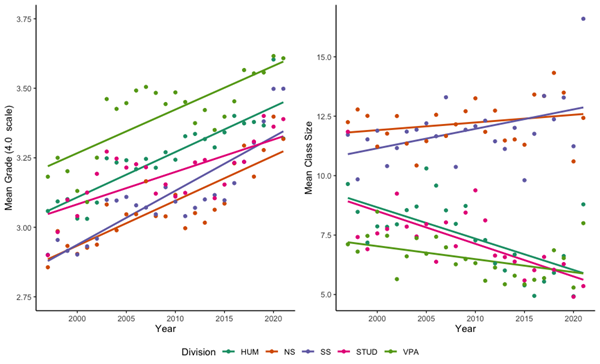
The relationship between academic year and mean grade (left) and year and class size (right). Academic divisions are color coded. HUM = Humanities, NS = Natural sciences, SS = Social sciences, STUD = Cross-divisional studies, and VPA = Visual and performing arts.
Chris Smith
Class size across disciplines is, predictably, negatively associated with grades, and so the disciplines with the highest grades have the smallest classes. Whether calculated as the raw number of students per class or as a proportion of the total college enrollment, the natural and social science class sizes have increased over time while all others have decreased. Despite this, the rate of grade increase is consistent across all of the disciplines.
Regardless of the discipline a student majors in, the average student tends to start in larger classes (introductory sequences) before specializing in a major. As noted previously, increasing class size has a predictably strong negative effect on mean grade and variance, and so it is very predictable that freshman students tend to have the lowest grades. And because class size decreases with increasing specialization, mean grades tend to increase as a student progresses through college. The average student should expect a near half-grade-point increase between their first and last year.
One additional factor that seems to affect grades is the total enrollment of the college. In this sample, grade inflation is not completely linear; rather, there is an acceleration in grade inflation after about 2009. The Great Recession of 2007–09 had a major impact on small colleges, and the acceleration in grade inflation after 2009 coincides with a decrease in overall student enrollment at the selective Midwestern liberal arts college. In fact, prior to the recession, grades had been positively associated with enrollment (enrollment was trending up and grades were following their typical inflationary trajectory), but after the recession the correlation became negative and steeper. Yes, class size also decreased over this time, but total enrollment is still a significant predictor of grades in models with both factors. Total college enrollment therefore may play into grade increases due to the competition for students.
The idea of competition playing a role in grade inflation is something that may make faculty cringe but nonetheless seems a reality of the current state of affairs in higher education; enrollment drives budgets and thus policy and course offerings. Classes, majors or departments with low enrollments are more likely to be cut. With fewer students there is more competition for students, both between institutions and within them. The use of grades as an incentive to attract students in individual classes scales up to the level of the whole institution. Of all of the factors affecting grades discussed so far, competition is the hardest to digest because it commodifies the grade and implicates instructors in a scheme wherein grades deviate from their core purpose.
Academic year, class size, subject, student year (freshman to senior) and college enrollment all uniquely affect grades. That is, when modeled, the best model is one that includes all of these factors. All faculty ought to be thinking about why a freshman student can be expected to get lower grades than a student from any other class and whether they think that is reasonable. Similarly, faculty at all institutions should ask themselves whether a student majoring in physics should expect lower grades than an art major (all else being equal). If we don’t actively engage in a philosophy of grades and grading then we are burying our heads in the sand; we are assuming that our assignment of grades occurs in a vacuum, unaffected by our colleagues, institutions and the educational landscape.
The predictable increase in grades over time is a decentralized, self-perpetuating and unidirectional process. No one person is to blame; we all are. The problem of grade inflation must be addressed or else grades will become meaningless.
There are many essays and opinion pieces that discuss grade inflation and its causes as well as its solutions. Some institutions have taken action by reporting grades along with rankings or percentiles, or dropping grades completely in favor of commentary about performance. Many high schools have just added another grade point for more challenging classes like Advanced Placement or International Baccalaureate courses. While all of these solutions seem reasonable, all institutions ought to be doing something. And because grades can be a potential mechanism of competition between and within institutions, we should all actually do the same things. The quintessential call to action is as apt here as anywhere: If not you, who? If not now, when? As to “who,” I am speaking to all my fellow faculty, but especially to deans, provosts, accreditors and others who have the capacity to make a meaningful structural change.


