You have /5 articles left.
Sign up for a free account or log in.
2019 NACUBO-TIAA Study of Endowments
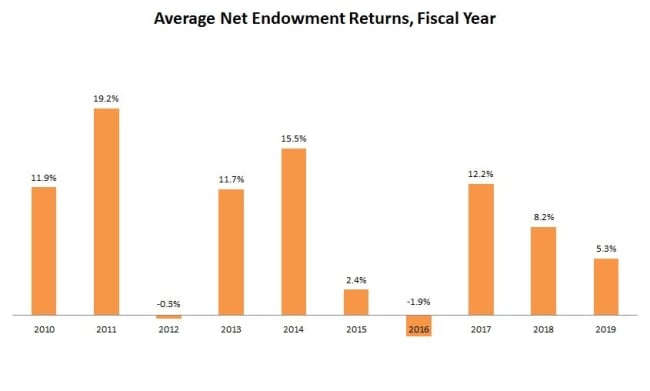
College and university endowment returns averaged 5.3 percent, net of fees, in the 2019 fiscal year, according to an annual study released today by the National Association of College and University Business Officers.
The 2019 average return dipped from an average 8.2 percent return in 2018 and 12.2 percent in 2017, reflecting generally lower equity market returns. But it was still enough to push the 10-year average return to 8.4 percent. That’s because 2009, when endowment returns cratered amid the financial crisis, dropped out of the 10-year average.
“That represents a very strong recovery period after an almost 19 percent drawdown that occurred in fiscal year 2009 as a result of the global financial crisis,” said Dimitri Stathopoulos, head of U.S. Institutional Sales at Nuveen, which is owned by the NACUBO study’s sponsor, TIAA, during a conference call to discuss the results.
An increase in the 10-year average is important to colleges and universities because institutions generally use returns over the previous decade to gauge whether their endowment spending levels are appropriate. Endowments are not designed to function like checking accounts to be drawn down over time -- they are structured to exist into perpetuity, with spending offset by growth in asset values. Experts often recommend managers look most closely at 10-year averages because year-to-year investment performance can vary significantly.

Endowment spending fell safely under rates of return. The average spending rate was 4.5 percent in 2019, according to the study, known as the NACUBO-TIAA Study of Endowments. That’s virtually identical to 4.4 percent in each of the previous two years. Average spending rates have ranged between 4.2 percent and 4.6 percent over the last decade.
Endowments must also offset the cost of inflation to keep their purchasing power from waning over time. Inflation came in at 2.5 percent in 2019, as measured by the Higher Education Price Index, meaning endowment spending plus that inflationary index was 7 percent. Over the last decade, endowment spending plus HEPI has not exceeded 7.8 percent, meaning the measure has consistently slotted in below the average 10-year return.

“I’m actually very happy to see the spending rates in the mid-4s,” said Kevin O’Leary, CEO of TIAA Endowment and Philanthropic Services. “Speaking with institutions, they have been looking to see how they can lower that spending rate even further, if possible. The reason for that is that 8.4 percent 10-year average is reflective of the incredible bull market that we’ve had coming out of the great financial recession. As we move forward, especially looking at where the industry is engaging capital returns, it is going to be harder and harder to continue to get those types of returns.”
Indeed, institutions have been lowering their long-term return objectives. They set spending objectives of 7.7 percent as of 2010 but have since slowly moved objectives down to just 7 percent in 2019.
“What this is telling you is that institutions -- their expectations and their budgeting for expected future returns -- has been moving lower since the great financial crisis,” Stathopoulos said.
Looking back further into the past to examine periods that include both up and down years reveals somewhat lower rates of return. The 15-year rate of return is 6.7 percent, and the 20-year rate of return is 6.2 percent.
Endowment spending is a major part of many college and university operating budgets, said Liz Clark, vice president for policy and research at NACUBO. Leaders need to take past results and the foreseeable future into account when setting spending rates.
“They have to budget and plan not just for the current year but for years out, and it can be difficult to manage an institution’s budget if endowment spending is constantly moving up and down,” she said.
None of this means institutions are spending less on average in dollars than in the past. Total endowment withdrawals rose by 8 percent, or $1.6 billion, to slightly less than $22.7 billion in 2019. The average endowment withdrawal increased by 6 percent, or about $1.7 million, to $30.4 million.
Nearly half of spending from endowments in the study, 49 percent, went to student financial aid. Another 17 percent went to academic programs, 11 percent went to endowed faculty positions and 7 percent was dedicated to the operation and maintenance of campus facilities. The remaining 16 percent of spending was categorized in a catch-all “other purposes” bucket.
That breakdown is in line with spending in last year’s study, the first in the series of annual studies to delve into how endowment dollars are spent.
Large Endowments Return More Over Time
Investment returns varied substantially over time between the largest and smallest endowments. This year’s study divided endowments into seven different segments based on size. The largest endowments, valued at more than $1 billion, outperformed endowments of all other sizes over one-year, three-year, five-year and 10-year time frames. In 2019, the smallest endowments, those valued at $25 million or less, came closest to matching the largest endowments’ performance with an average return of 5.8 percent.
| Net Annualized Return | Total Institutions | Over $1 Billion | Over $500 Million- $1 Billion |
Over $250 Million- $500 Million |
Over $100 Million- $250 Million |
Over $50 Million- $100 Million |
Over $25 Million- $50 Million |
$25 Million and Under |
|---|---|---|---|---|---|---|---|---|
| One-year (FY19) | 5.3% | 5.9% | 5.1% | 5.0% | 5.1% | 4.9% | 5.5% | 5.8% |
| Three-year | 8.7% | 9.6% | 8.9% | 8.9% | 8.5% | 8.3% | 8.3% | 8.3% |
| Five-year | 5.2% | 6.1% | 5.1% | 5.3% | 5.0% | 4.9% | 4.9% | 5.5% |
| 10-year | 8.4% | 9.0% | 8.5% | 8.4% | 8.3% | 8.2% | 8.4% | 7.7% |
Source: 2019 NACUBO-TIAA Study of Endowments
Large endowments’ performance can be explained in part by the fact that they have greater access to buyout and venture capital investments than smaller endowments do. Such investments were among the highest performing in 2019.
Small endowments, on the other hand, tend to invest more heavily in U.S. bonds and equities than larger endowments do. That may have helped their performance in 2019, as those asset classes did well during colleges’ 2019 fiscal year.
| Net Annualized Return | Total Institutions | Over $1 Billion | Over $500 Million- $1 Billion |
Over $250 Million- $500 Million |
Over $100 Million- $250 Million |
Over $50 Million- $100 Million |
Over $25 Million- $50 Million |
$25 Million and Under |
|---|---|---|---|---|---|---|---|---|
| U.S. Equities | 14.1% | 11.2% | 20.7% | 21.1% | 28.4% | 31.6% | 37.8% | 45.7% |
| Non-U.S. Equities | 14.5% | 13.9% | 17.1% | 16.7% | 15.7% | 14.9% | 14.6% | 12.2% |
| Global Equities | 6.6% | 6.2% | 7.5% | 9.1% | 9.1% | 8.1% | 5.3% | 2.7% |
| Other Equities | 39.0% | 43.2% | 30.3% | 27.1% | 18.1% | 14.8% | 10.1% | 5.6% |
| Fixed Income | 11.7% | 10.1% | 14.4% | 15.7% | 19.5% | 23.1% | 26.5% | 29.7% |
| Real Assets | 12.3% | 13.5% | 9.2% | 8.4% | 7.1% | 6.0% | 4.6% | 3.2% |
| Cash/Other | 1.7% | 1.8% | 0.8% | 1.8% | 2.0% | 1.5% | 1.1% | 0.9% |
Source: 2019 NACUBO-TIAA Study of Endowments
Asset allocations over all were little changed from the 2018 fiscal year.
Size and Scale
A total of 774 U.S. colleges, universities and related foundations took part in the NACUBO study. Their endowment assets totaled $630 billion as of June 30, 2019. The median endowment size came in at $144.4 million.
About 38 percent of participants, 294 institutions, were public colleges, universities, systems or their foundations. Their assets totaled $202.6 billion, or 32.1 percent of all assets reported. Private colleges and universities were the remainder, meaning 62 percent of institutions held 67.9 percent of assets.
Looking at all institutions, public and private, assets were sharply concentrated in 107 endowments each valued at $1 billion or more. They held $493.8 billion, meaning 13.9 percent of institutions held a whopping 78.3 percent of endowment value.
The 10 institutions with the highest endowment values held just under $224 billion, about 35.6 percent of all assets in the study. For comparison’s sake, the pension fund for New York State, the third largest in the country, was valued at about $210.5 billion in March 2019.
Below are the 25 largest endowments in the country and their changes in size between the 2018 and 2019 fiscal years. Change in size is not the rate of return referenced throughout this article. It includes several additional factors that can affect endowment size in additional to investment gains and losses: withdrawals, gifts and contributions, and management and investment fees.
| Institution | 2019 Endowment Funds (in $1,000s) | 2018 Endowment Funds (in $1,000s) | Change in Market Value (percent) |
|---|---|---|---|
| Harvard University | 39,427,896 | 38,298,087 | 2.95 |
| University of Texas System | 30,958,239 | 30,886,018 | 0.23 |
| Yale University | 30,314,800 | 29,351,100 | 3.28 |
| Stanford University | 27,699,834 | 26,464,912 | 4.67 |
| Trustees of Princeton University | 26,116,022 | 25,917,199 | 0.77 |
| Massachusetts Institute of Technology | 17,569,328 | 16,529,432 | 6.29 |
| University of Pennsylvania | 14,649,762 | 13,777,441 | 6.33 |
| Texas A&M University System | 13,514,528 | 13,524,947 | -0.08 |
| University of Michigan | 12,448,817 | 11,901,760 | 4.60 |
| University of Notre Dame | 11,268,365 | 10,727,653 | 5.04 |
| Northwestern University | 11,091,516 | 11,087,659 | 0.03 |
| University of California | 11,008,035 | 11,797,543 | -6.69 |
| Columbia University in the City of New York | 10,950,738 | 10,869,245 | 0.75 |
| DUMAC Inc. (Duke University) | 8,609,004 | 8,524,846 | 0.99 |
| University of Chicago | 8,263,868 | 7,928,485 | 4.23 |
| Washington University in St. Louis | 7,953,986 | 7,594,159 | 4.74 |
| Emory University | 7,872,381 | 7,292,165 | 7.96 |
| Cornell University | 7,328,241 | 7,230,291 | 1.35 |
| University of Virginia | 7,058,235 | 6,856,309 | 2.95 |
| Rice University | 6,481,102 | 6,277,506 | 3.24 |
| Johns Hopkins University | 6,275,939 | 4,190,520 | 49.77 |
| Vanderbilt University | 6,270,877 | 4,608,461 | 36.07 |
| University of Southern California | 5,732,101 | 5,549,556 | 3.29 |
| Dartmouth College | 5,731,322 | 5,494,204 | 4.32 |
| Ohio State University | 5,256,759 | 5,211,434 | 0.87 |
Source: 2019 NACUBO-TIAA Study of Endowments