You have /5 articles left.
Sign up for a free account or log in.
istockphoto.com/dimarik
The number of international students in the U.S. fell by 2.2 percent at the undergraduate level and 5.5 percent at the graduate level from fall 2016 to 2017, according to a new report from the National Science Foundation, “Science and Engineering Indicators,” released last week.
The analysis is based on government-held student visa data and excludes students who are participating in optional practical training, a program that allows international students to stay and work in the U.S. for up to three years after graduating while remaining on their university's sponsorship.
| 2016 | 2017 | Percent Change | |
| All Fields | |||
| Undergraduate | 450,850 | 440,720 | -2.2% |
| Graduate | 389,310 | 367,920 | -5.5% |
| Science and Engineering Fields | |||
| Undergraduate | 176,570 | 176,930 | 0.2% |
| Graduate | 244,040 | 229,310 | -6% |
| Non-Science and Engineering Fields | |||
| Undergraduate | 274,280 | 263,790 | -3.8% |
| Graduate | 145,270 | 138,610 | -4.6% |
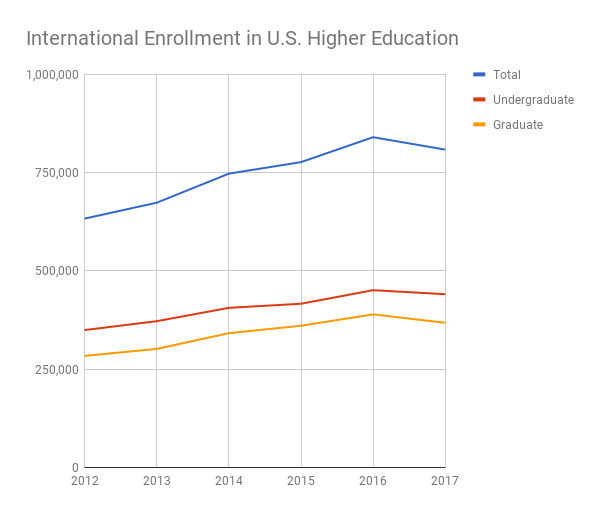
The declines come on the heels of years of steady growth (see line graph below) in overall international enrollments at U.S. universities and amid widespread concern that prospective new students could be deterred by the current political climate and uncertainty about immigration policies in the United States.
The declines, if they were to continue, could have negative implications for U.S. competitiveness and the health of American graduate science and engineering programs, which are heavily populated by international students. In 2015, international students made up 36 percent of all science and engineering graduate students in the U.S. and received more than half of all doctoral degrees awarded in computer science, economics, engineering, and mathematics and statistics.
The student visa-sourced data provide the first comprehensive national picture of international enrollments for the current academic year. It differs from an annual report on international enrollment conducted by the Institute of International Education, called Open Doors, which surveys universities about their international enrollments and reports the data on a one-year lag.
In November, Open Doors reported a 3.3 percent decline in new (as opposed to total) international students in the 2016-17 academic year and an overall flattening of growth.
A companion "snapshot" survey IIE conducted in association with other academic groups asked about 500 institutions about their international enrollments for the current academic year. Over all, the universities in the survey reported an average decline in new international enrollments of 7 percent. But the declines weren't being felt across the board: while 45 percent of institutions responding to the snapshot survey reported declines in new international students, 31 percent reported increases and 24 percent reported no change.
Among the reasons university officials have given for the declines in international student enrollments are the political and social environment in the U.S., the high cost of U.S. higher education, visa denial and delays, increasing competition from other countries, and changes to other governments' scholarship programs, such as Saudi Arabia's.
Here are a few of the international enrollment-related highlights of the NSF report:
- At the undergraduate level, the number of international students increased in computer sciences (11 percent) and mathematics (5 percent) and declined in engineering (-5 percent), social sciences (-3 percent) and nonscience and engineering fields (-4 percent), from 2016 to 2017.
- The top five countries sending international science and engineering undergraduates to the U.S. in fall 2017 were China, Saudi Arabia, India, South Korea and Kuwait. From fall 2016 to 2017, the number of undergraduates studying science and engineering increased from China (3 percent), India (11 percent) and Kuwait (4 percent), while the number decreased from Saudi Arabia (-18 percent) and South Korea (-7 percent).
- At the graduate level, the number of international students decreased in the computer sciences (-12.9 percent) and engineering (-7.6 percent) between fall 2016 and fall 2017. The number of international students increased in mathematics (by 14.6 percent),and remained fairly stable in other science and engineering fields.
- The top countries sending international science and engineering graduate students to the U.S. were China and India -- which together account for 69 percent of all international graduate students in science and engineering fields -- followed by Iran, South Korea, Saudi Arabia and Taiwan. From 2016 to 2017 the number of graduate science and engineering students increased from China (4 percent) and Taiwan (5 percent), and decreased from India (-19 percent), Saudi Arabia (-11 percent), Iran (-1 percent) and South Korea (-1 percent).


