You have /5 articles left.
Sign up for a free account or log in.
2016 NACUBO-Commonfund Study of Endowments
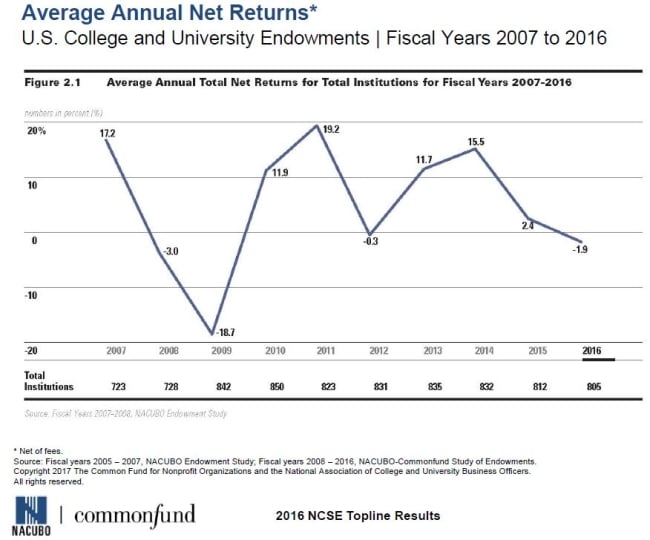
College and university endowments’ net returns declined for the second straight year in 2016, dropping into negative territory and posting their worst results since the depths of the financial crisis.
Endowments returned an average of -1.9 percent in the 2016 fiscal year that ended in June, net of fees, according to an annual survey released Tuesday by the National Association of College and University Business officers and the nonprofit asset management firm Commonfund. That’s significantly below last year’s return of 2.4 percent and follows a decade of volatile ups and downs. It’s also substantially lower than the 7.4 percent median annual return endowments are generally considered to need to average in order to maintain their purchasing power over time.
The year’s negative returns dragged down 10-year average annual returns to 5 percent, down from 6.3 percent a year ago. It knocked the 5-year average annual return rate to 5.4 percent, down from 9.8 percent a year ago. And it pulled the 3-year average annual return rate to 5.2 percent from 9.9 percent last year.
Negative returns for the year should not come as a surprise after early reports in the fall indicated the largest college and university endowments struggled in the 2016 fiscal year. But they could still cause problems for institutions trying to balance demands for endowment spending on priorities like financial aid and research against the need to grow the funds so they can continue to exist in the future.
“There’s no number here that’s anywhere near 7.4 percent,” said William F. Jarvis, Executive Director of the Commonfund Institute, in a conference call on the results. “This is a period in which formulation of investment policy for long-term institutions becomes very, very challenging.”
Even though investment returns plunged, a large majority of survey respondents reported increasing the amount they spent from their endowments.
Nearly three-quarters of respondents, 74 percent, said they increased endowment dollars spent to support their institutions’ missions. The median increase among institutions that reported boosting spending came in at 8.1 percent, which was above the rate of inflation.
“Our institutions obviously felt, even in an environment where the investment returns were negative, that they have the need to rely on endowment funds,” said John D. Walda, NACUBO president and CEO.
Endowment spending has been under the political microscope lately. Some have argued that tax-advantaged endowments should be subject to minimum payout requirements, similar to requirements placed on private foundations. Notably, U.S. Representative Tom Reed, a Republican from New York, has been an outspoken advocate of the idea.
But Walda said such a change could hurt endowments in the future.
“There is, as many of you know, increased pressure from some policy makers and members of Congress to further raise endowment spending by instituting mandatory payout rates with regard to student financial aid,” Walda said. “This could easily hamper an institutions’ ability to manage spending rates in a prudent way.”
Regardless of any possible changes to the law, last year’s combination of negative returns and higher spending could signal a problem for colleges and universities that rely on endowment spending for large portions of their operating budgets. Endowment spending funds 9.7 percent of survey respondents’ operating budgets, on average.
Large institutions drew even more of their operating budgets from endowment spending. Among institutions with endowment assets of more than $1 billion, endowment spending funded an average of 15.9 percent of operating budgets. Institutions with assets of $25 million or less drew just 4.6 percent of their operating budgets from endowments, on average.
That doesn’t mean institutions with small endowments are in the clear, though. They are more exposed to year-to-year fluctuations.
“Particularly the small institutions that are in the study, if we have another couple of years of stagnant returns -- if I can call them that -- they’re going to have to seriously consider cutting back on the amount of dollars that are spent at their institutions,” Walda said. “Smaller endowments, I think, have the most volatility to them as a result of these returns, and obviously they have more of a challenge in growing the corpus of the endowment through additional gifting.”
A total of 805 institutions participated in this year’s study of endowments. Participants’ endowments totaled $515.1 billion. The average endowment came in at $639.9 million, but that was driven up by a top-heavy field featuring eight endowments totaling $10 billion or more. Almost half of the survey’s participants reported endowments of $100 million or less.
All six endowment size categories experienced negative rates of return. Institutions with assets of under $25 million experienced the highest average rate of return, -1 percent. Those with assets between $101 million and $500 million experienced the lowest average return, -2.4 percent. The 1.4 percentage point spread between high and low returns by asset class was narrow compared to previous studies. Last year, the spread was 2.4 percentage points.
Average Percent Return by Endowment Size
| All Institutions | $1B+ | $501M - $1B | $101M-$500M | $51M-$100M | $25M-$50M | Under $25M | |
|---|---|---|---|---|---|---|---|
| Average FY2016 Return | -1.9 | -1.9 | -2.2 | -2.4 | -1.8 | -1.6 | -1.0 |
Among five asset classes tracked in the survey, fixed income posted the highest return. Fixed income returned 3.6 percent in the fiscal year, up from 0.2 percent the year before. One other asset class had a positive return, a class that included short-term securities, cash and other assets. Its return was 0.2 percent, up incrementally from no return in the previous fiscal year.
Meanwhile, U.S. equities returned -0.2 percent, down from 6.4 percent the year before. Non-U.S. equities returned -7.8 percent, down from -2.1 percent. Alternative strategies returned -1.4 percent, down from 1.1 percent.
“Basically, the best way to describe it is that the U.S. equity market was the best house in a challenged neighborhood, the challenged neighborhood being public equity returns in general,” said Mark Anson, Commonfund chief investment officer.
The survey found variance within the different classes that make up the alternative strategies category. Non-campus private equity real estate returned 7.1 percent, down from 9.9 percent the previous year. Private equity, such as international private equity and merger-and-acquisition funds, returned 4.5 percent, down from 9.3 percent. Venture capital returned 1.5 percent, plunging from 15.1 percent. Other alternative strategies posted negative returns, notably commodities and managed futures, which returned -7.7 percent -- a level that still managed to come in ahead of the -17.7 percent return it posted in the prior year.
Institutions with assets below $25 million dedicated relatively large chunks of their investments to fixed income and U.S. equities when compared to larger colleges and universities -- 24 percent and 44 percent, respectively. Since fixed income was the year’s top-performing asset class, it helped to drive small endowments’ returns above those of their larger peers. Institutions with assets over $1 billion, on the other hand, only reported an average fixed income allocation of 7 percent and a U.S. equities allocation of 13 percent. Those same large institutions reported 58 percent allocation, on average, to the lower-performing alternative strategies class.
Still, endowments on the whole changed their dollar-weighted asset allocations very little from year-to-year. U.S. equities held steady at 16 percent in 2016 and 2015. Non-U.S. equities held stable as well at 19 percent, and short-term securities were level at 4 percent. Fixed income dropped a percentage point to 8 percent in 2016. Alternative strategies ticked up by a percentage point to 53 percent.
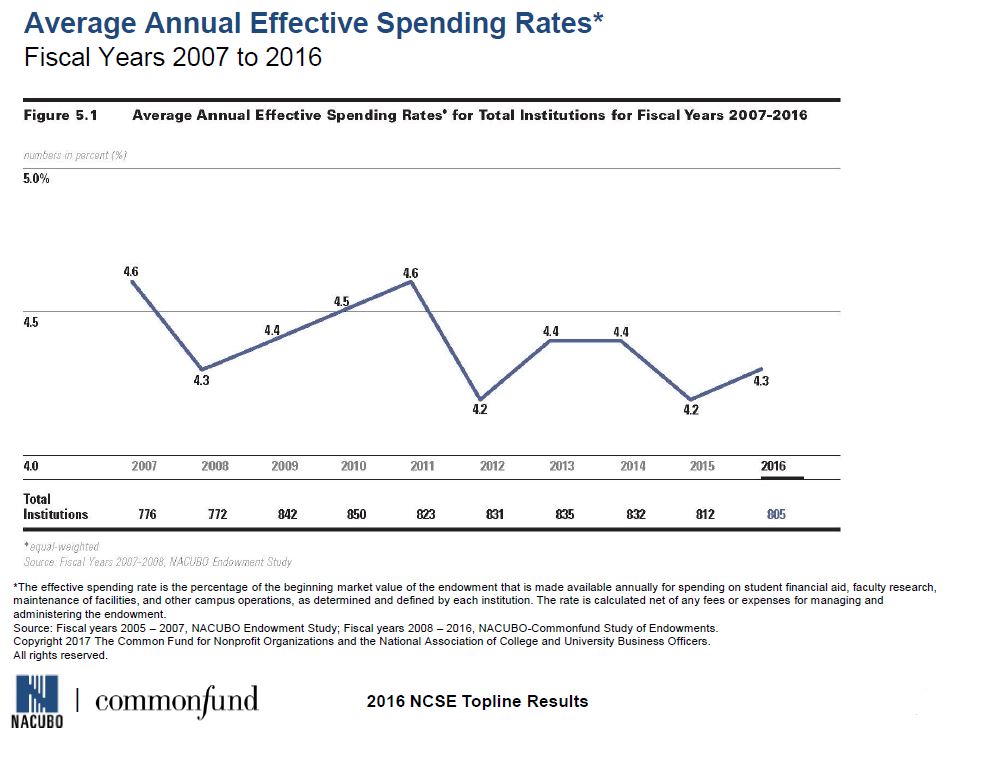
The effective spending rate for all 805 survey participants averaged 4.3 percent in 2016. That’s up incrementally from 4.2 percent the year before. Institutions with assets of more than $1 billion reported the highest effective spending rate, 4.4 percent. Those with assets under $25 million reported the lowest, 3.8 percent.
Gifts to endowments rose slightly, with the median total of new gifts to endowments rising to $2.8 million in 2016 from $2.7 million the previous year. The average new gift totaled $12.9 million, up from $10 million. But more institutions reported a decrease in gifts than reported an increase -- 48 percent said gifts decreased and 44 percent said gifts increased.
The survey also covered institutional debt. A majority of survey participants said they held long-term debt -- 594 out of 805. Average total debt of those institutions was $230.2 million as of June 30, 2016, up from $219.1 million the year before. Median debt also rose, climbing to $61.5 million from $58.2 million. Just under a third of participants, 30 percent, said they increased debt in the 2016 fiscal year. Meanwhile, 66 percent reported decreasing debt.
Below are the 25 largest endowments in the country and their change in size between 2015 and 2016.
Colleges and Universities with the Largest Endowments
| Institution | 2015 Endowment Value (in $1,000) | 2016 Endowment Value (in $1,000) | Percent Change |
|---|---|---|---|
| Harvard University | 36,448,817 | 34,541,893 | -5.2 |
| Yale University | 25,572,100 | 25,408,600 | -0.6 |
| The University of Texas System | 24,083,150 | 24,203,213 | 0.5 |
| Stanford University | 22,222,957 | 22,398,130 | 0.8 |
| Princeton University | 22,723,473 | 22,152,580 | -2.5 |
| Massachusetts Institute of Technology | 13,474,743 | 13,181,515 | -2.2 |
| University of Pennsylvania | 10,133,569 | 10,715,364 | 5.7 |
| The Texas A&M University System and Foundations | 10,477,102 | 10,539,526 | 0.6 |
| University of Michigan | 9,952,113 | 9,743,461 | -2.1 |
| Northwestern University | 10,193,037 | 9,648,497 | -5.3 |
| Columbia University | 9,639,065 | 9,041,027 | -6.2 |
| University of Notre Dame | 8,566,952 | 8,374,083 | -2.3 |
| University of California | 7,997,099 | 8,341,073 | 4.3 |
| The University of Chicago | 7,549,710 | 7,001,204 | -7.3 |
| Duke University | 7,296,545 | 6,839,780 | -6.3 |
| Washington University in St. Louis | 6,818,748 | 6,461,717 | -5.2 |
| Emory University | 6,684,305 | 6,401,650 | -4.2 |
| University of Virginia | 6,180,515 | 5,852,309 | -5.3 |
| Cornell University | 6,037,546 | 5,757,722 | -4.6 |
| Rice University | 5,557,479 | 5,324,289 | -4.2 |
| University of Southern California | 4,709,511 | 4,608,714 | -2.1 |
| Dartmouth College | 4,663,491 | 4,474,404 | -4.1 |
| Vanderbilt University | 4,133,542 | 3,822,187 | -7.5 |
| Pennsylvania State University | 3,635,730 | 3,602,312 | -0.9 |
| Ohio State University | 3,633,887 | 3,578,562 | -1.5 |


