You have /5 articles left.
Sign up for a free account or log in.
More students than ever are taking the ACT, says the ACT’s annual score report, released today. A record 1.84 million high school students who graduated in 2014 took the college readiness test – suggesting that more young people have college in their sights. But for many test-takers, succeeding in postsecondary education might be an empty hope. Average scores remain stagnant. Only 39 percent of test-takers met three or more of the ACT’s college readiness benchmarks in English, math, reading and science – a percentage that’s unchanged from last year. And striking racial gaps persist. As in previous years, African Americans and Latinos scored much lower, on average, than their Asian-American and white peers.
Fifty-seven percent of the nation’s graduating class took the ACT, a small increase from last year. The increase suggests growing interest in college, yes. But it also reflects the sustained prestige of the ACT, which in 2012 overtook the SAT as the most popular college admissions test. The number of ACT-taking high school graduates has increased 17.7 percent since 2010. The College Board typically releases average SAT scores shortly after the ACT report comes out.
Eighty-six percent of test-takers reported that they planned to pursue postsecondary education. Last year, in comparison, 87 percent of 2013 high school graduates who took the ACT said they planned to pursue education after high school. Only 69 percent enrolled in a postsecondary institution.
Many students faltered on the ACT’s college readiness benchmarks. The benchmarks are minimum scores that claim to predict a 75 percent chance of earning a C or higher in a college course in that area. This year, 64 percent of test-takers met the benchmark in English; 44 percent met the benchmark in reading; 43 percent met the standard in mathematics and 37 percent did so in science.
Roughly 26 percent of tested students met all four benchmarks. The average ACT score was 21 out of 36 possible points – up by 0.1 points from last year.
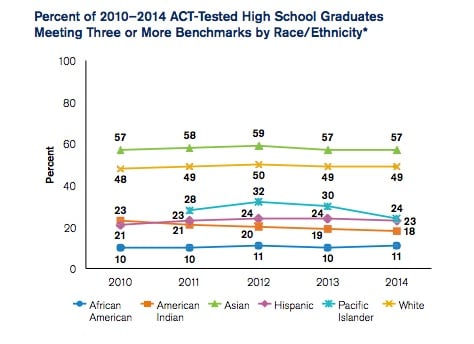
On the benchmarks, Asian-American test-takers did best, with 57 percent meeting three or more. Forty-nine percent of white test-takers met three or more standards – compared to 23 percent of Latino test-takers and 11 percent of African-American test-takers. African Americans scored lowest on the test. Just 10 percent of African-American students who were tested met the science benchmark.
The average composite score for African Americans was 17.0, an increase of just 0.1 points from 2010. Latinos earned an average composite score of 18.8. White students notched an average of 22.3 points, and Asians recorded an average of 23.5.
The ACT also shared data on how well students in different states performed on the test. Massachusetts had the highest composite score, with its students notching an average of 24.3 points. Hawaii ranked lowest, with an average composite score of 18.2.