You have /5 articles left.
Sign up for a free account or log in.

Job ads published with the Modern Language Association declined for a fifth straight year in 2016-17, reaching another new low, according to a preliminary report from the MLA.

The association’s Job Information List -- a proxy for the tenure-track (or otherwise full-time) job market in English and foreign languages -- included 851 jobs last year in English, 11 percent (102 jobs) fewer than the year before. The foreign language edition list included 808 jobs, or 12 percent (110 jobs) fewer than the year before.

The declines of the past five years bring the number of total jobs advertised to another new low, according to MLA, below the dip seen between 2007-08 and 2009-10.

Number of Jobs Advertised in the JIL, 1975-76 to 2016-17. Line graph shows changes in English and foreign language jobs. In 1975-76, there were 1,450 English jobs, 1,338 in 1982-83, 2,075 in 1988-89, 1,075 in 1993-94, 1,828 in 2000-01, 1,826 in 2007-08, 1,100 in 2009-10, 1,235 in 2011-12, and 851 in 2016-17. In 1975-76, there were 1,515 foreign language jobs, 1,166 in 1981-82, 1,873 in 1988-89, 1,047 in 1993-94, 1,482 in 2000-01, 1,680 in 2007-08, 1,022 in 2009-10, 1,128 in 2011-12, and 808 in 2016-17.

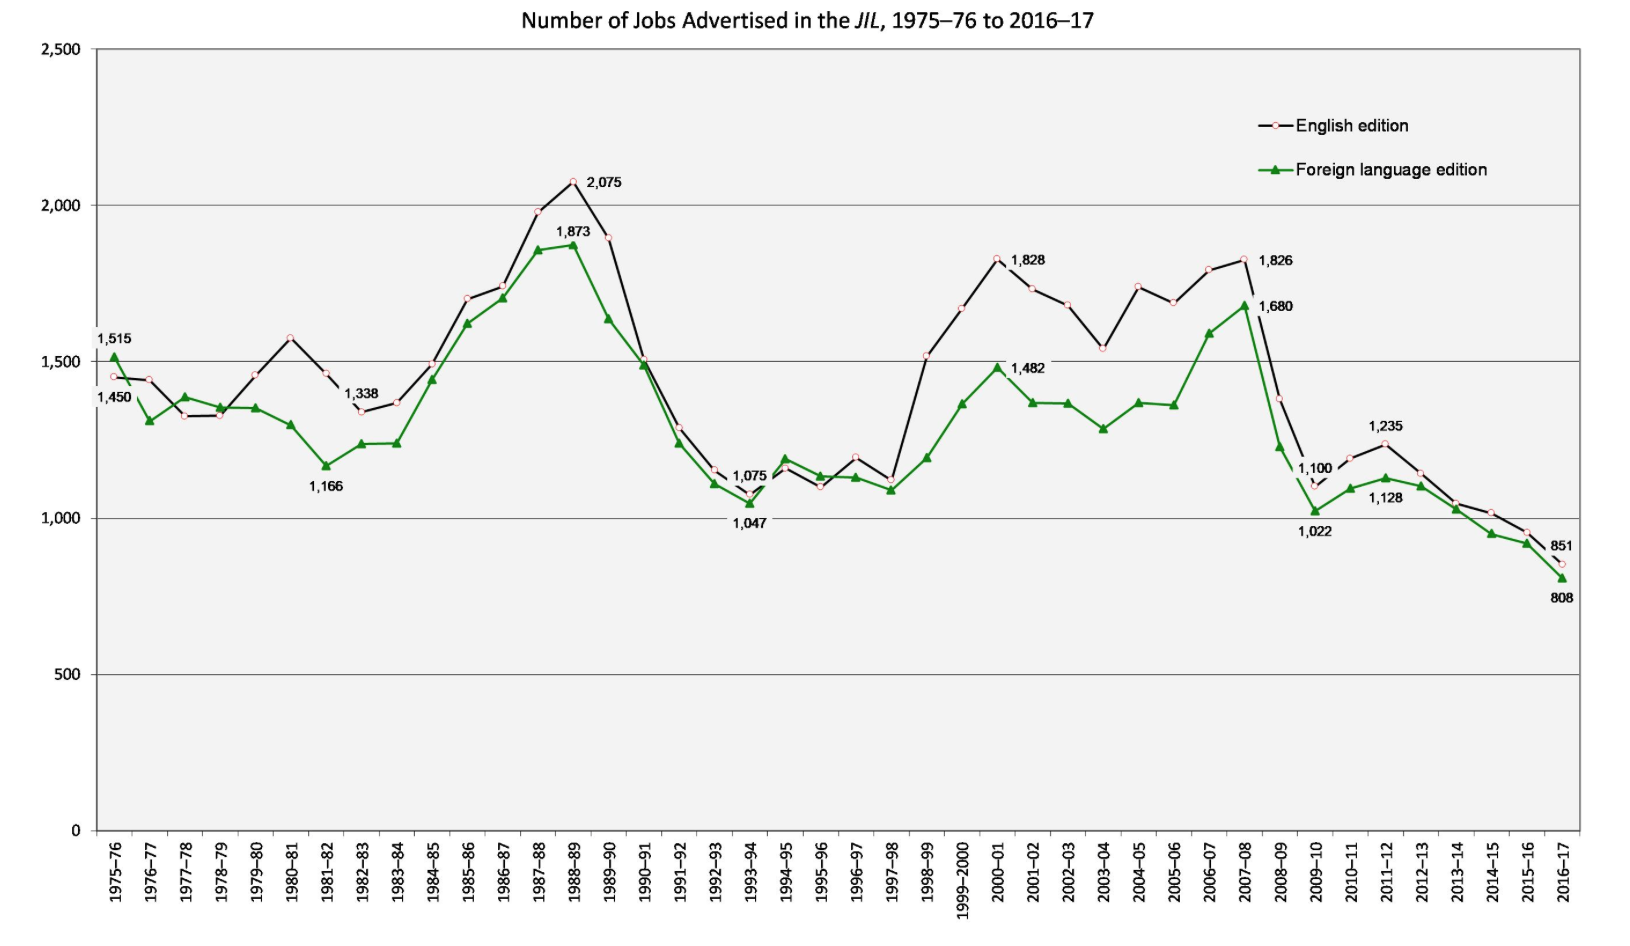
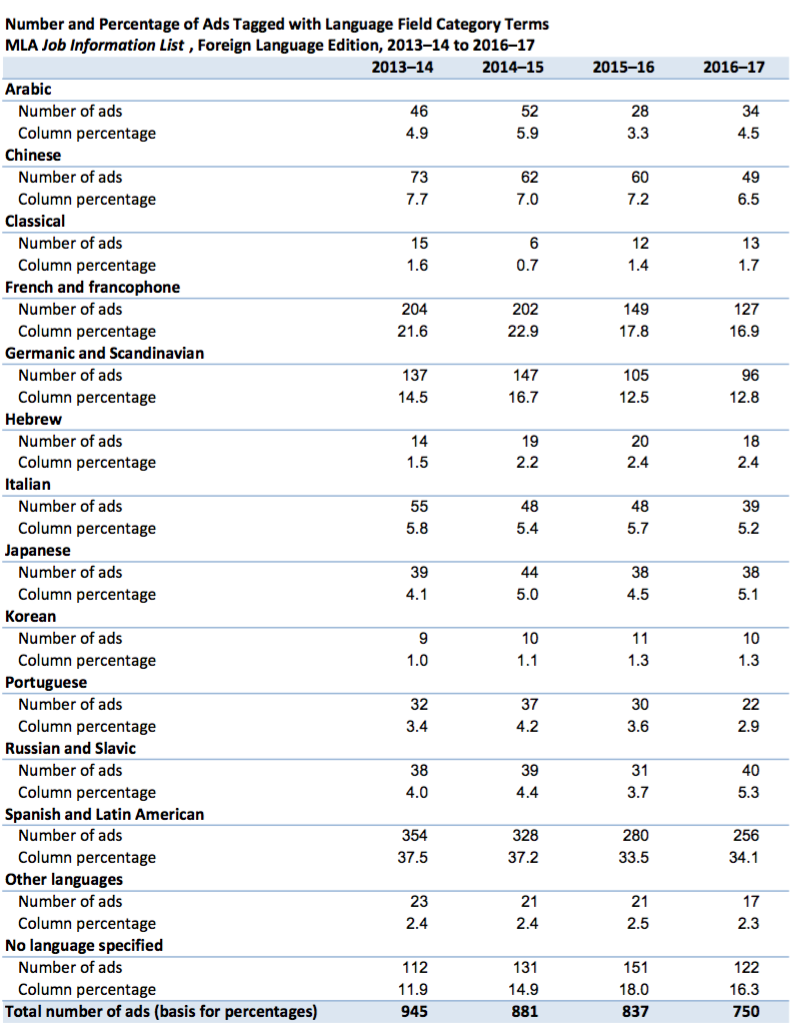
Source: Modern Language Association

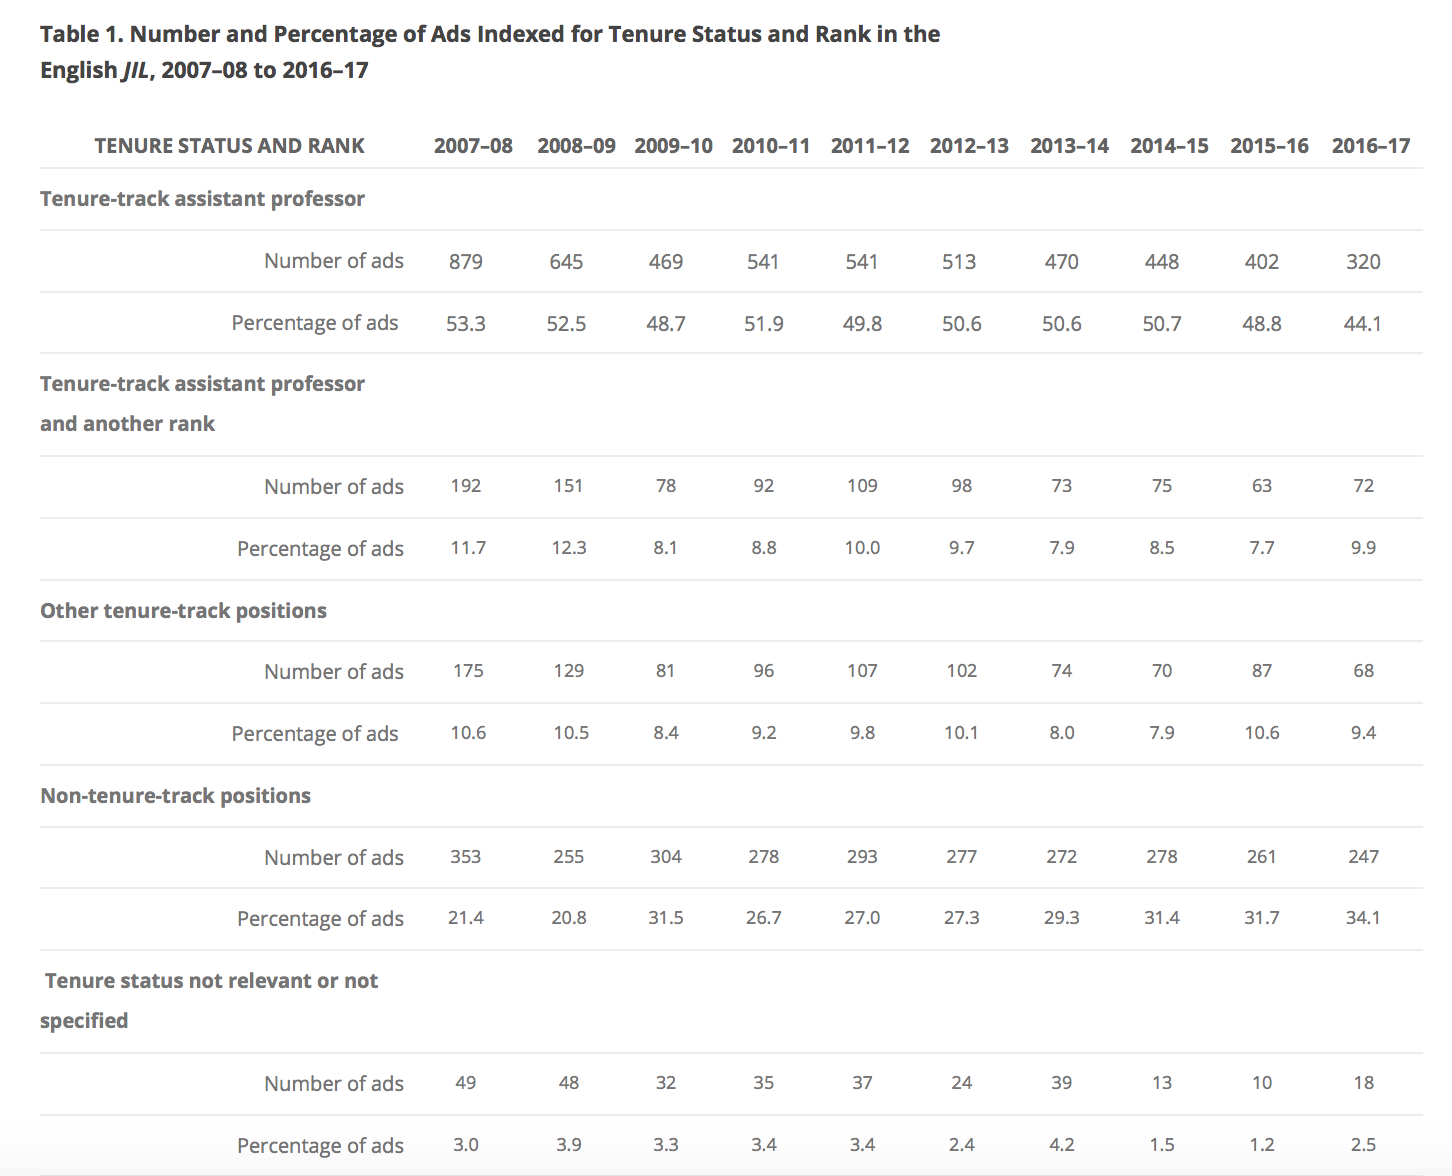
MLA notes that the share of all job ads in English that are tenure-line has fallen to under 65 percent, from about 75 percent in 2008-09.

Table 1. Number and Percentage of Ads Indexed for Tenure Status and Rank in the English JIL, 2007-08 to 2016-17. For tenure-track assistant professor, 879 ads in 2007-08 (53.3 percent), 645 ads in 2008-09 (52.5 percent), 469 ads in 2009-10 (48.7 percent), 541 ads in 2010-11 (51.9 percent), 541 ads in 2011-12 (49.8 percent), 513 ads in 2012-13 (50.6 percent), 470 ads in 2013-14 (50.6 percent), 448 ads in 2014-15 (50.7 percent), 402 ads in 2015-16 (48.8 percent), 320 ads in 2016-17 (44.1 percent). For tenure-track assistant professor and another rank, 192 ads in 2007-08 (11.7 percent), 151 ads in 2008-09 (12.3 percent), 78 ads in 2009-10 (8.1 percent), 92 ads in 2010-11 (8.8 percent), 109 ads in 2011-12 (10 percent), 98 ads in 2012-13 (9.7 percent), 73 ads in 2013-14 (7.9 percent), 75 ads in 2014-15 (8.5 percent), 63 ads in 2015-16 (7.7 percent), 72 ads in 2016-17 (9.9 percent). For other tenure-track positions, 175 ads in 2007-08 (10.6 percent), 129 ads in 2008-09 (10.5 percent), 81 ads in 2009-10 (8.4 percent), 96 ads in 2010-11 (9.2 percent), 107 ads in 2011-12 (9.8 percent), 102 ads in 2012-13 (10.1 percent), 74 ads in 2013-14 (8 percent), 70 ads in 2014-15 (7.9 percent), 87 ads in 2015-16 (10.6 percent), 68 ads in 2016-17 (9.4 percent). For non-tenure-track positions, 353 ads in 2007-08 (21.4 percent), 255 ads in 2008-09 (20.8 percent), 304 ads in 2009-10 (31.5 percent), 278 ads in 2010-11 (26.7 percent), 293 ads in 2011-12 (27 percent), 277 ads in 2012-13 (27.3 percent), 272 ads in 2013-14 (29.3 percent), 278 ads in 2014-15 (31.4 percent), 261 ads in 2015-16 (31.7 percent), 247 ads in 2016-17 (34.1 percent). Where tenure status was not relevant or not specified, 49 ads in 2007-08 (3 percent), 48 ads in 2008-09 (3.9 percent), 32 ads in 2009-10 (3.3 percent), 35 ads in 2010-11 (3.4 percent), 37 ads in 2011-12 (3.4 percent), 24 ads in 2012-13 (2.4 percent), 39 ads in 2013-14 (4.2 percent), 13 ads in 2014-15 (1.5 percent), 10 ads in 2015-16 (1.2 percent), 18 ads in 2016-17 (2.5 percent).

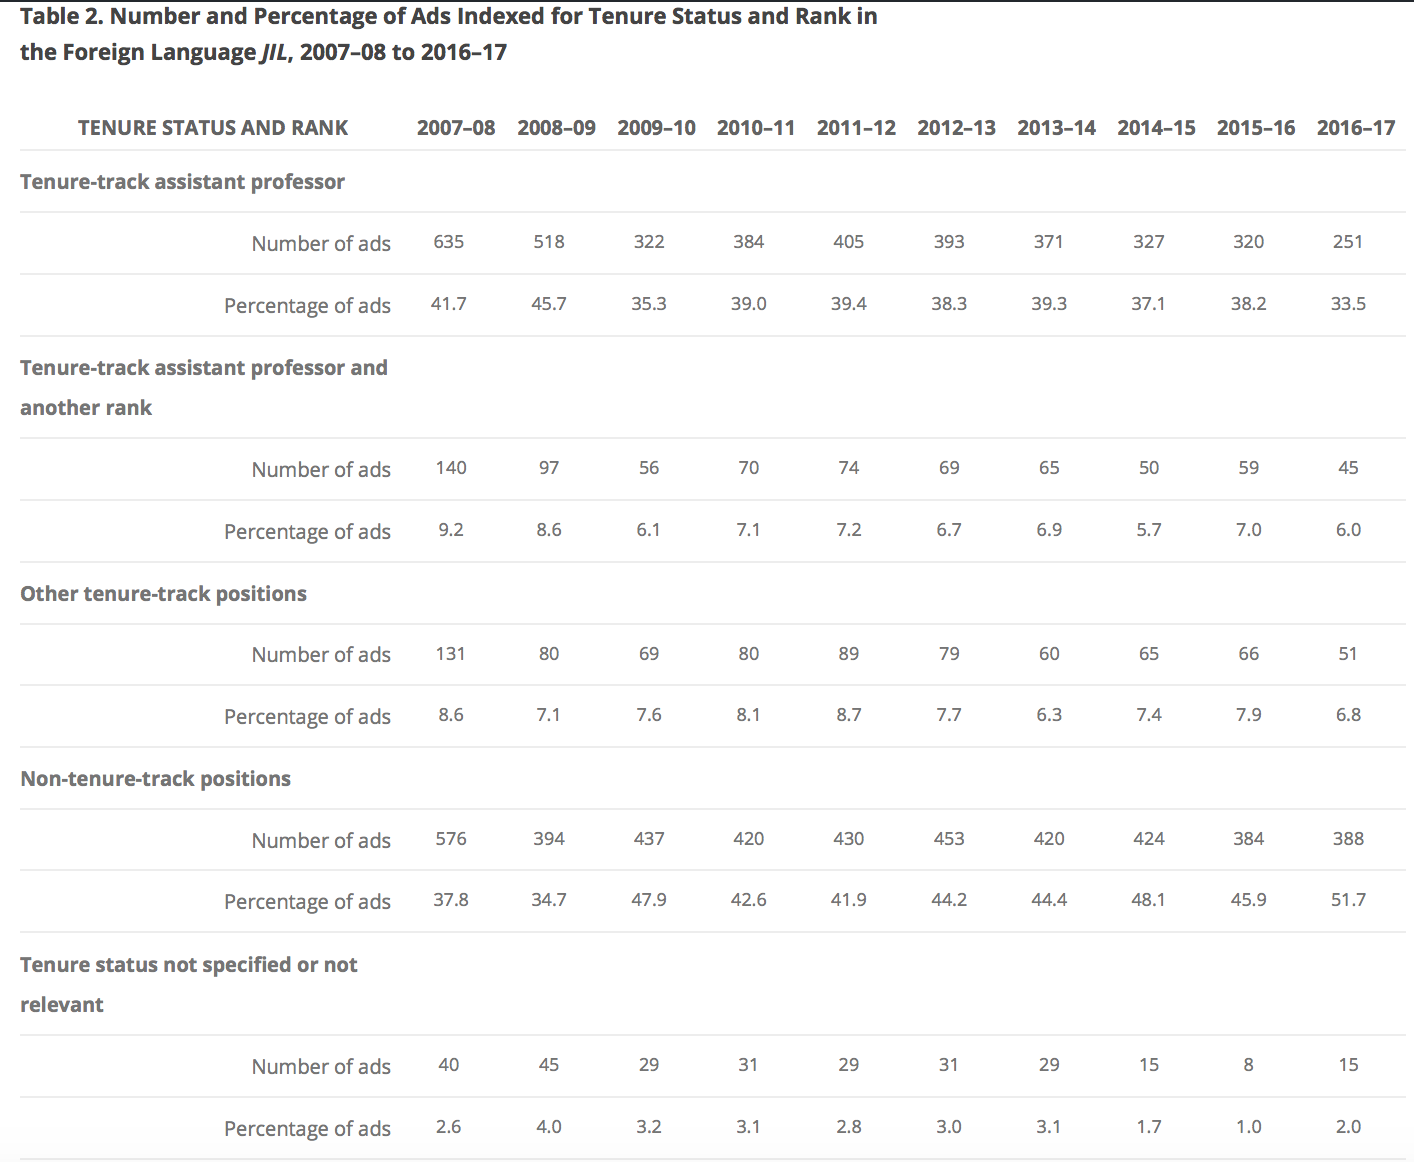
In foreign languages, the share of all jobs ads that are tenure-line has fallen from about 60 percent to just over 45 percent over the same period.

Table 2. Number and Percentage of Ads Indexed for Tenure Status and Rank in the Foreign Language JIL, 2007-08 to 2016-17. For tenure-track assistant professor, 635 ads in 2007-08 (41.7 percent), 518 ads in 2008-09 (45.7 percent), 322 ads in 2009-10 (35.3 percent), 384 ads in 2010-11 (39 percent), 405 ads in 2011-12 (39.4 percent), 393 ads in 2012-13 (38.3 percent), 371 ads in 2013-14 (39.3 percent), 327 ads in 2014-15 (37.1 percent), 320 ads in 2015-16 (38.2 percent), 251 ads in 2016-17 (33.5 percent). For tenure-track assistant professor and another rank, 140 ads in 2007-08 (9.2 percent), 97 ads in 2008-09 (8.6 percent), 56 ads in 2009-10 (6.1 percent), 70 ads in 2010-11 (7.1 percent), 74 ads in 2011-12 (7.2 percent), 69 ads in 2012-13 (6.7 percent), 65 ads in 2013-14 (6.9 percent), 50 ads in 2014-15 (5.7 percent), 59 ads in 2015-16 (7 percent), 45 ads in 2016-17 (6 percent). For other tenure-track positions, 131 ads in 2007-08 (8.6 percent), 80 ads in 2008-09 (7.1 percent), 69 ads in 2009-10 (7.6 percent), 80 ads in 2010-11 (8.1 percent), 89 ads in 2011-12 (8.7 percent), 79 ads in 2012-13 (7.7 percent), 60 ads in 2013-14 (6.3 percent), 65 ads in 2014-15 (7.4 percent), 66 ads in 2015-16 (7.9 percent), 51 ads in 2016-17 (6.8 percent). For non-tenure-track positions, 576 ads in 2007-08 (37.8 percent), 394 ads in 2008-09 (34.7 percent), 437 ads in 2009-10 (47.9 percent), 420 ads in 2010-11 (42.6 percent), 430 ads in 2011-12 (41.9 percent), 453 ads in 2012-13 (44.2 percent), 420 ads in 2013-14 (44.4 percent), 424 ads in 2014-15 (48.1 percent), 384 ads in 2015-16 (45.9 percent), 388 ads in 2016-17 (51.7 percent). Where tenure status was not relevant or not specified, 40 ads in 2007-08 (2.6 percent), 45 ads in 2008-09 (4 percent), 29 ads in 2009-10 (3.2 percent), 31 ads in 2010-11 (3.1 percent), 29 ads in 2011-12 (2.8 percent), 31 ads in 2012-13 (3 percent), 29 ads in 2013-14 (3.1 percent), 15 ads in 2014-15 (1.7 percent), 8 ads in 2015-16 (1 percent), 15 ads in 2016-17 (2 percent).

A more detailed report from the MLA is expected later this year. In the interim, the association shared a breakdown of jobs ads for positions in languages other than English. The number of ads for jobs in Arabic, Chinese, French, Germanic and Scandinavian languages, Italian, Portuguese and Spanish continued their multiyear declines.

Available positions in Russian and Slavic languages increased year over year, from 31 in 2015-16 to 40 in 2016-17.

Number and Percentage of Ads Tagged With Language Field Category Terms, MLA Job Information List, Foreign Language Edition, 2013-14 to 2016-17. For Arabic, 46 ads in 2013-14 (4.9 percent), 52 ads in 2014-15 (5.9 percent), 28 ads in 2015-16 (3.3 percent), 34 ads in 2016-17 (4.5 percent). For Chinese, 73 ads in 2013-14 (7.7 percent), 62 ads in 2014-15 (7 percent), 60 ads in 2015-16 (7.2 percent), 49 ads in 2016-17 (6.5 percent). For classical languages, 15 ads in 2013-14 (1.6 percent), 6 ads in 2014-15 (0.7 percent), 12 ads in 2015-16 (1.4 percent), 13 ads in 2016-17 (1.7 percent). For French and francophone, 204 ads in 2013-14 (21.6 percent), 202 ads in 2014-15 (22.9 percent), 149 ads in 2015-16 (17.8 percent), 127 ads in 2016-17 (16.9 percent). For Germanic and Scandinavian languages, 137 ads in 2013-14 (14.5 percent), 147 ads in 2014-15 (16.7 percent), 105 ads in 2015-16 (12.5 percent), 96 ads in 2016-17 (12.8 percent). For Hebrew, 14 ads in 2013-14 (1.5 percent), 19 ads in 2014-15 (2.2 percent), 20 ads in 2015-16 (2.4 percent), 18 ads in 2016-17 (2.4 percent). For Italian, 55 ads in 2013-14 (5.8 percent), 48 ads in 2014-15 (5.4 percent), 48 ads in 2015-16 (5.7 percent), 39 ads in 2016-17 (5.2 percent). For Japanese, 39 ads in 2013-14 (4.1 percent), 44 ads in 2014-15 (5 percent), 38 ads in 2015-16 (4.5 percent), 38 ads in 2016-17 (5.1 percent). For Korean, 9 ads in 2013-14 (1 percent), 10 ads in 2014-15 (1.1 percent), 11 ads in 2015-16 (1.3 percent), 10 ads in 2016-17 (1.3 percent). For Portuguese, 32 ads in 2013-14 (3.4 percent), 37 ads in 2014-15 (4.2 percent), 30 ads in 2015-16 (3.6 percent), 22 ads in 2016-17 (2.9 percent). For Russian and Slavic languages, 38 ads in 2013-14 (4 percent), 39 ads in 2014-15 (4.4 percent), 31 ads in 2015-16 (3.7 percent), 40 ads in 2016-17 (5.3 percent). For Spanish and Latin American languages, 354 ads in 2013-14 (37.5 percent), 328 ads in 2014-15 (37.2 percent), 280 ads in 2015-16 (33.5 percent), 256 ads in 2016-17 (34.1 percent). For other languages, 23 ads in 2013-14 (2.4 percent), 21 ads in 2014-15 (2.4 percent), 21 ads in 2015-16 (2.5 percent), 17 ads in 2016-17 (2.3 percent). For no language specified, 112 ads in 2013-14 (11.9 percent), 131 ads in 2014-15 (14.9 percent), 151 ads in 2015-16 (18 percent), 122 ads in 2016-17 (16.3 percent). Total ads: 945 in 2013-14, 881 in 2014-15, 837 in 2015-16, 750 in 2016-17.

Robert Townsend, director of the Washington office of the American Academy of Arts and Sciences, said MLA’s data seem “quite consistent” with other data on jobs in the humanities, such as a recent, sobering jobs report from the American Historical Association and a jobs snapshot from the academy.

The academy report, for example, says that the number of jobs advertised with disciplinary associations in the humanities linger “substantially below pre-recession levels.”

As to precisely what’s driving the continued decline of available full-time positions, Townsend said he thought it was still “an open question.” Possible factors include changes in the ways jobs are advertised, a decline in faculty retirements, a drop in enrollments or a shift toward more adjunct instructors.

“Unfortunately, we lack the data we need to really tease out the underlying variables at work here,” he said. “There is still more work to be done there.”

Next Story

More from Tenure