You have /5 articles left.
Sign up for a free account or log in.
States last year doled out roughly the same amount of student aid money in 2012-13 as they did the previous year, but they increased the share of money flowing to students based on financial need, according to a new survey published Monday.
The annual survey, conducted by the National Association of State Student Grant and Aid Programs, found that although the top-line number of state aid -- $11.28 billion -- actually declined just slightly from the previous year when adjusting for inflation, states collectively boosted their investment in need-based grant aid.
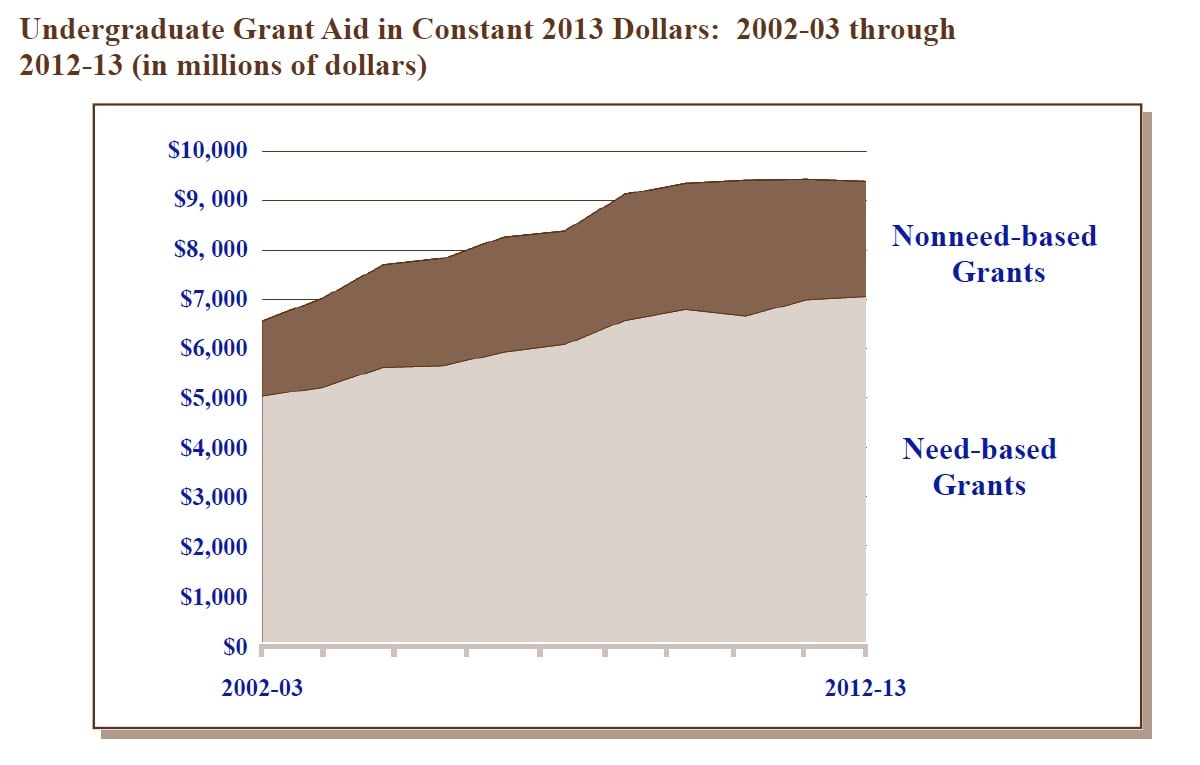
States increased their spending on need-based grant aid by 3.5 percent in the 2012-13 academic year, while non-need-based grant aid declined by 2.1 percent. In inflation-adjusted dollars, states reduced their spending on aid with a merit component to $3.98 billion last year from $4.02 billion the previous year. (An earlier version of this paragraph incorrectly said spending on grants with a merit component was in the millions; in fact, states spend billions on such aid.)
Among the states that saw increases in spending on need-based grant aid were Arizona (35.1 percent), Washington (18.3 percent increase), North Carolina (24.1 percent), and Minnesota (12.7 percent).
The amount of need-based grants that states funded per each full-time equivalent student increased by 5.7 percent, from $482 in 2011-12 to $509 last year. Sixteen states also increased the maximum amount a student can receive in their need-based grant program.
Of all grant aid awarded by states last year, a full three-quarters of the aid was awarded to students on the basis of need, which is the highest rate in at least the past five years, the survey found.
"There is recognition in some states that non-need-based aid can be somewhat inefficient because you're providing dollars to people who are going to go to college anyway," said Frank Ballmann, who directs the Washington office for the association. But, he added, "we take the view that any investment in state student grant aid is better than no investment."
Ballmann also said that his group's survey shows that "while at the federal level, there may be a lot of partisan debate over higher education, at the state level there is bipartisan support for need-based grant aid programs."
He pointed to the fact that of the eight states providing the majority of the nation's need-based aid, four are led by Republican governors and four by Democrats.
In Washington, meanwhile, the Obama administration has touted the increase in Pell Grant funding in its first term as one of its crowning higher education achievements. In contrast, House Republicans have proposed reductions to the program, arguing in their most recent budget that the grants had become "more generous than the federal budget could afford."
Total Grant Aid Awarded, 2012-13 (in millions)
| State |
Need-based Grant Aid |
Nonneed- based Grant Aid |
Nongrant Aid |
Total |
| Alabama | $6.937 | $2.599 | - | $9.536 |
| Alaska | 3.945 | 5.655 | 7.310 | 16.911 |
| Arizona | 21.436 | - | 0.277 | 21.713 |
| Arkansas | 9.396 | 146.146 | 2.926 | 158.468 |
| California | 1,519.221 | 1.989 | 23.931 | 1,545.141 |
| Colorado | 74.722 | 0.365 | 30.388 | 105.475 |
| Connecticut | 45.486 | 0.339 | 92.801 | 138.626 |
| Delaware | 13.951 | 6.975 | 0.956 | 21.882 |
| Florida | 153.371 | 320.143 | 76.498 | 550.012 |
| Georgia | - | 535.992 | 2.530 | 538.521 |
| Hawaii | 3.225 | - | 0.563 | 3.788 |
| Idaho | 1.101 | 4.227 | 1.374 | 6.701 |
| Illinois | 370.909 | 1.049 | 7.659 | 379.617 |
| Indiana | 252.595 | 6.913 | 25.931 | 285.438 |
| Iowa | 57.610 | 5.189 | 0.958 | 63.756 |
| Kansas | 17.817 | 0.081 | 3.900 | 21.797 |
| Kentucky | 87.192 | 108.265 | 2.617 | 198.074 |
| Louisiana | 26.163 | 191.905 | 0.040 | 218.108 |
| Maine | 16.407 | - | 1.872 | 18.279 |
| Maryland | 88.514 | 5.084 | 5.795 | 99.393 |
| Mass. | 85.547 | 7.296 | 44.512 | 137.355 |
| Michigan | 91.701 | 0.973 | 0.104 | 92.778 |
| Minnesota | 169.452 | 0.884 | 83.184 | 253.520 |
| Mississippi | 5.618 | 19.226 | 7.857 | 32.701 |
| Missouri | 63.616 | 40.646 | - | 104.262 |
| Montana | 4.162 | 1.350 | 0.863 | 6.375 |
| Nebraska | 15.999 | - | 109.863 | 125.862 |
| Nevada | 36.269 | 23.053 | 18.887 | 78.210 |
| New Hampshire | - | - | - | - |
| New Jersey | 365.932 | 10.112 | 185.569 | 561.612 |
| New Mexico | 25.433 | 81.125 | 9.895 | 116.453 |
| New York | 941.292 | 31.723 | 65.693 | 1,038.708 |
| North Carolina | 332.852 | 8.371 | 73.514 | 414.738 |
| N. Dakota | 10.905 | 7.102 | 1.634 | 19.641 |
| Ohio | 86.048 | 35.351 | 0.666 | 122.065 |
| Oklahoma | 83.347 | 11.102 | 180.745 | 275.194 |
| Oregon | 52.134 | 0.032 | 87.475 | 139.641 |
| Pa. | 450.897 | 0.365 | 26.341 | 477.603 |
| Puerto Rico | 36.612 | - | 0.048 | 36.660 |
| Rhode Island | 12.406 | - | - | 12.406 |
| SC CHE | 23.377 | 293.715 | 1.937 | 319.029 |
| SC TGC | 36.126 | - | - | 36.126 |
| S. Dakota | - | 4.336 | 0.548 | 4.884 |
| Tennessee | 89.524 | 284.092 | 1.579 | 375.195 |
| Texas | 703.389 | - | 166.096 | 869.485 |
| Utah | 3.484 | 6.240 | 80.539 | 90.262 |
| Vermont | 20.117 | 0.080 | 0.394 | 20.592 |
| Virginia | 157.940 | 81.723 | 191.747 | 431.411 |
| Washington | 343.851 | 1.832 | 17.835 | 363.518 |
| Wash., D.C. | 1.177 | 32.959 | - | 34.136 |
| W. Virginia | 45.267 | 61.006 | 40.642 | 146.915 |
| Wisconsin | 120.834 | 2.993 | 7.036 | 130.863 |
| Wyoming | 15.470 | - | - | 15.470 |
| Total | $7,200.774 | $2,390.602 | $1,693.530 | $11,284.906 |