You have /5 articles left.
Sign up for a free account or log in.
State support for higher education surged in Illinois in 2017, but the data are skewed by a 2016 budget impasse that depressed appropriations.
Illinois Office of the Architect of the Capitol
The number of states leaning heavily on tuition to pay for instruction at public colleges and universities grew last year, surpassing a significant symbolic milestone.
A total of 28 states used tuition to generate more than 50 percent of their total educational revenue in the 2017 fiscal year, according to the State Higher Education Executive Officers association’s annual State Higher Education Finance report, which was released today. It was the first time more than half of states were recorded relying more on tuition dollars than on government appropriations. Exactly 25 states did so in 2016.
“This number has been kind of slowly creeping up, and it's something we noticed this year,” said Andy Carlson, vice president of finance policy and member services at SHEEO. “There were always a great number of states that were above it -- Vermont, New Hampshire and Pennsylvania, for example.”
Tuition is one of two primary components of public institutions’ total educational revenue. Appropriations from state and local governments are the other. The breakdown between the sources is closely watched by both budget hawks and advocates who worry that high tuition costs block access to higher education.
Although more individual states’ higher education finances skewed toward tuition in 2017, the year was not marked by sharp drops in government support on average across the country. On the contrary, state and local appropriations rose 2.1 percent between 2016 and 2017 to total $94.5 billion.
Net tuition still made up less than half of total educational revenue nationwide. That’s because some large states, like California, skew heavily toward funding universities with government appropriations.
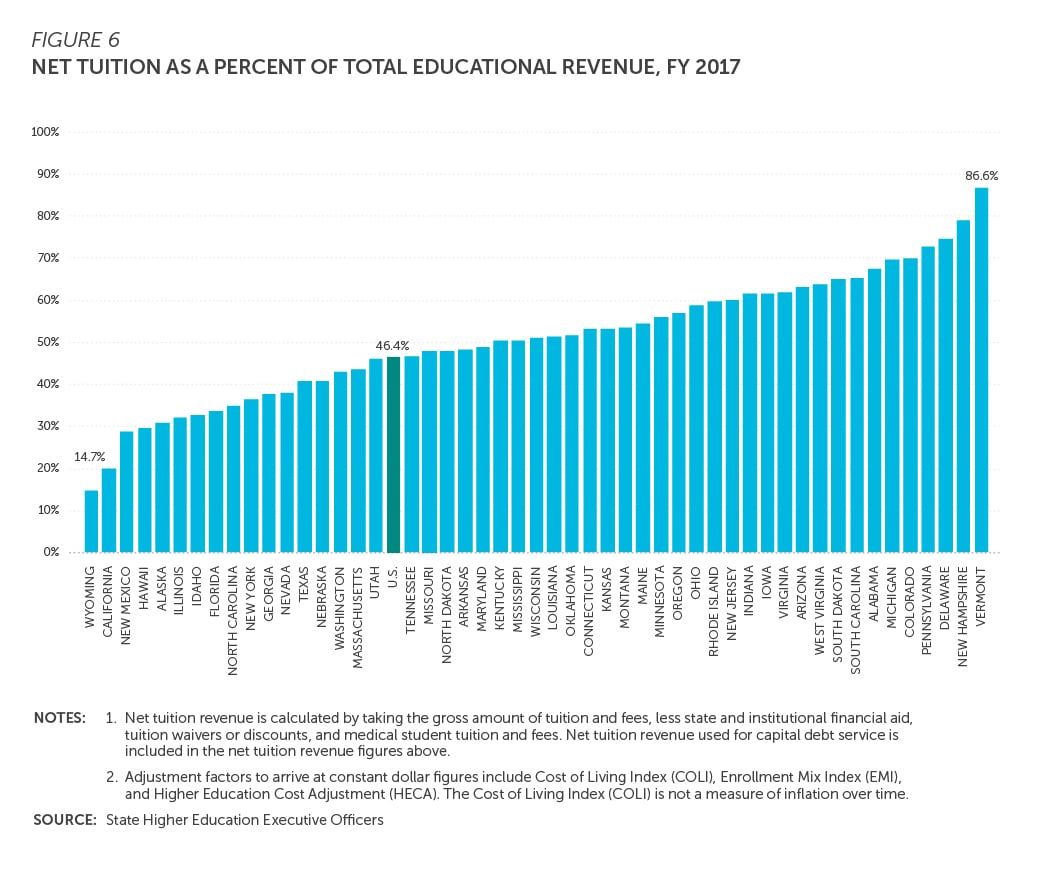
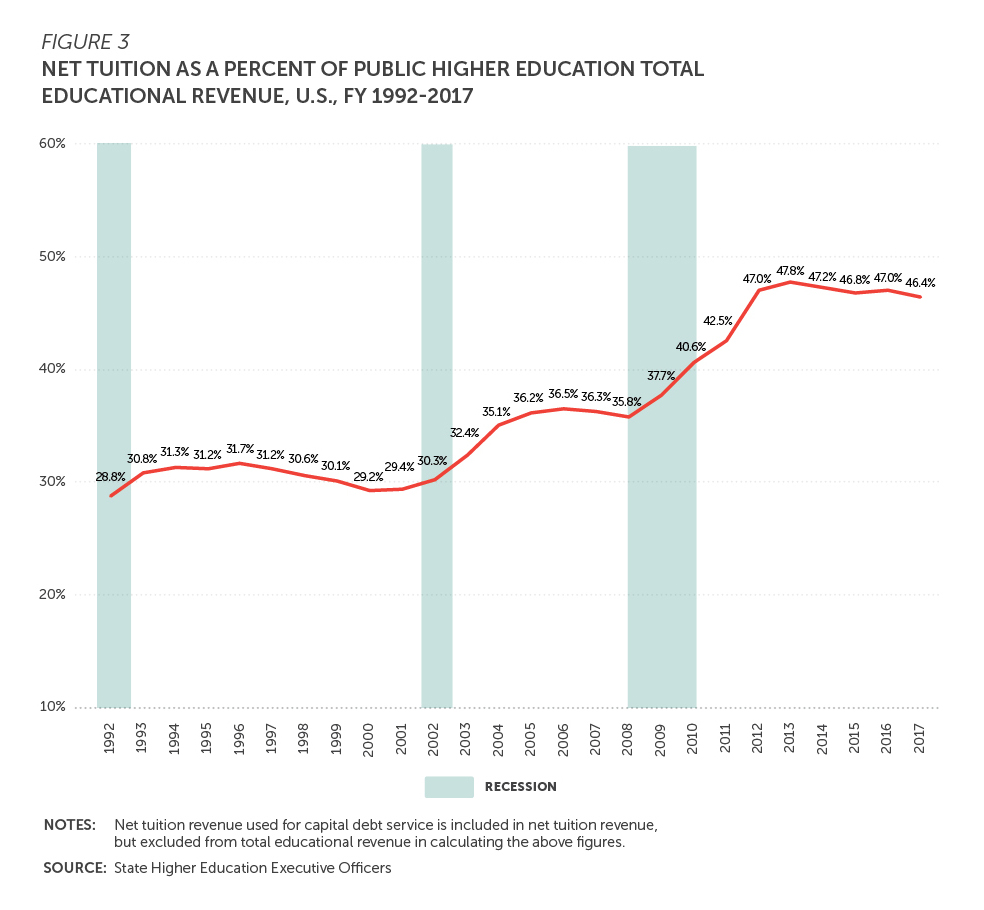
In fact, net tuition revenue slipped as a share of total educational revenue across the country in 2017. Tuition accounted for 46.4 percent of total education revenue, down from 47 percent in 2016 and below an all-time high of 47.8 percent in 2013.
Even so, public higher education has relied much more heavily on tuition since the start of the Great Recession in 2008. That year, net tuition was only 35.8 percent of total educational revenue across U.S. public higher education.
A slight majority of states, 27, increased their appropriations per full-time-equivalent student. Illinois, which saw public support for higher education plunge in 2016 amid a bitter state budget impasse, recovered to post the largest increase in 2017, which was 32.8 percent. The next-largest increase per student came in South Dakota, at 15.7 percent.
The highest educational appropriation per student was $18,200 in Wyoming. The lowest were less than $3,000 in Vermont and New Hampshire.
Net tuition revenue per student increased in 33 states. The largest increase came in Louisiana at 22.6 percent, although it was the only state with an increase of more than 10 percent. The largest decrease was in Missouri, 10.8 percent.
Changes in net tuition revenue aren't necessarily caused by higher or lower tuition rates charged to all students. A number of variables could be at play in different states, including changes in the number of students enrolled, changes in how many students enroll at high-cost flagship universities versus less expensive regional or community colleges, or a different level of enrollment among out-of-state students, who generally pay higher tuition rates than in-state students.
Michigan collected the highest net tuition revenue per full-time-equivalent student, $15,000. California collected the least, $2,000.
Nationwide, full-time-equivalent enrollment in public colleges and universities has been decreasing annually since 2011, likely due in part to an improving economy that opens jobs for some who might go to college if they did not have steady work available. Full-time-equivalent enrollment in public higher education fell by 0.1 percent from 2016 to 2017 and has fallen 5.2 percent since 2011, to 11 million.
Full-time-equivalent enrollment increased in 20 states. Utah had the largest increase, 11 percent. Louisiana and New Mexico tied for the largest decline, 4.7 percent.
The combined enrollment, appropriation and tuition changes add up to show public higher education receiving and spending more than it has since the report began collecting data in 1980. Total educational revenues grew 5.8 percent between 2008 and 2017 alone.
In 2017, total education revenues increased in 32 states.
Experts can point to numerous reasons colleges and universities may need more revenue. Often, they are facing higher costs. The costs of salaries and benefits are higher today than they have been in past decades. Maintenance costs can rise as campuses age. Many institutions are serving different student populations as demographics shift away from the traditional wealthy or middle-class 18- to 22-year-old white college student -- and adult students who haven't been to class in years can be more expensive to educate, as can students from low-income backgrounds and students who have attended struggling schools.
“The types of students that are served are very different,” said Sophia Laderman, senior policy analyst at SHEEO and the primary author of the SHEF report. “That could be a potential explanation, in addition to other things, like deferred maintenance costs and pensions.”
A Closer Look at Appropriations
On a per-student basis, educational appropriations across the country averaged $7,642, up by about 3 percent from 2016. Net tuition per full-time equivalent averaged $6,572, an increase of less than 1 percent from 2016.
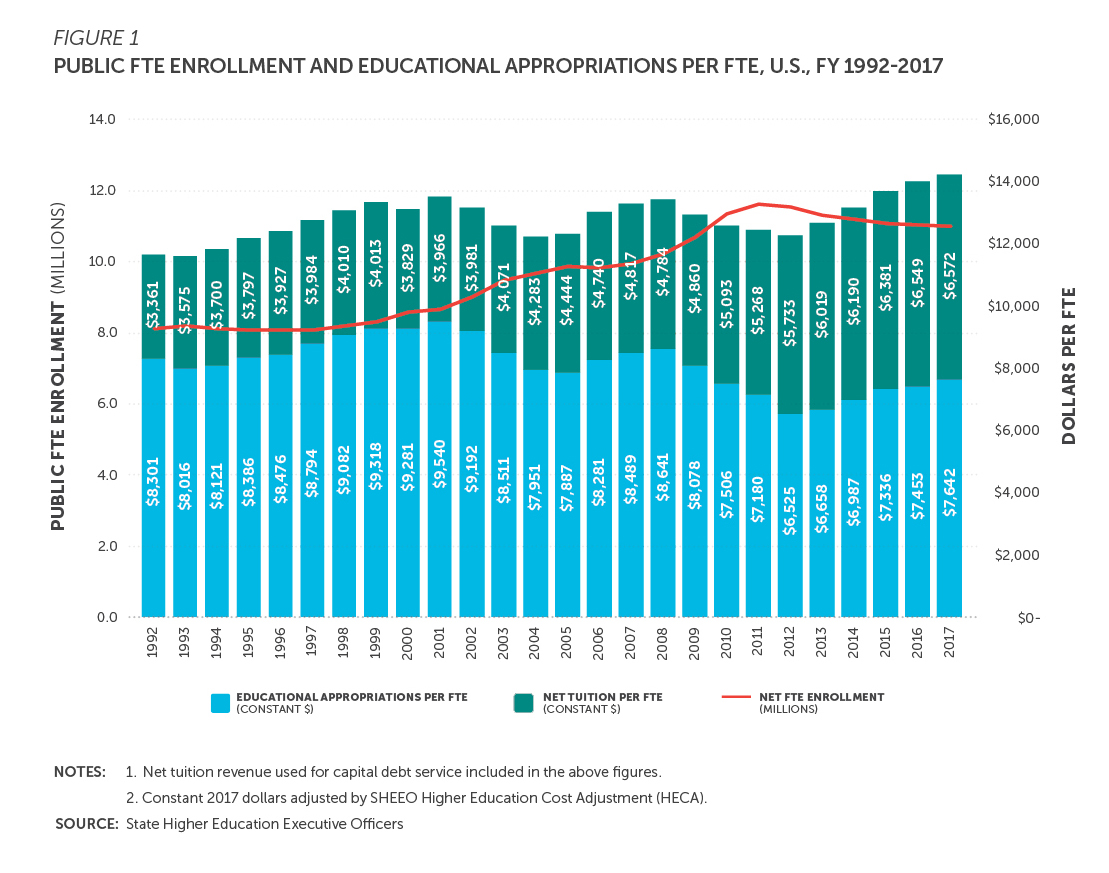
The single-year figures can obscure longer-term shifts. After adjusting for inflation, state appropriations per full-time equivalent student are about 10 percent below their levels of a decade ago and down 8 percent from 25 years ago. Net tuition per full-time equivalent is up 36 percent over a decade and up 96 percent over 25 years.
Laderman pointed out that in dollar terms, state support for higher education is down by about $1,000 per full-time equivalent since the start of the Great Recession.
“I think those figures are interesting, because it helps you see the student impact,” she said. “One thousand dollars less per full-time equivalent is pretty substantial.”
Many states are not able to return to funding higher education at pre-recession levels, Eileen Klein, president of the Arizona Board of Regents, said in a statement. Klein, who on Monday announced plans to step down from the board in June, chairs SHEEO’s executive committee.
“This is an era that calls for innovation among colleges and universities to develop new revenue streams to ensure our institutions remain competitive while counting on states to provide their fair share of funds for higher education,” she said.
State tax appropriations have remained the dominant source of public funding for higher education. They made up 85 percent of public support in 2017.
Only 29 states reported local tax appropriations, accounting for 10.8 percent of total public support nationally. Nontax appropriations came largely from state lotteries and made up 3.4 percent of all state support. State-funded endowment earnings were 0.6 percent of state support, and nonappropriated support from sources like oil or mineral extraction royalties were just 0.1 percent.
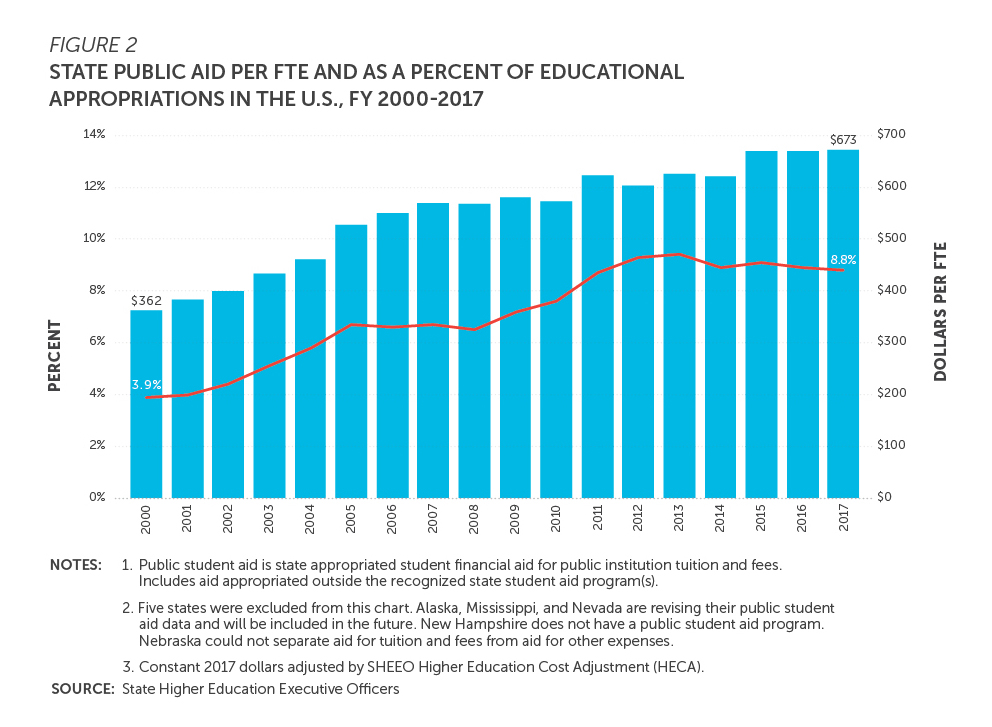
States allocated $9.8 billion to student financial aid programs in 2017. Financial aid per full-time-equivalent student has risen 86 percent since 2000 and reached a new high of $673 per student. But financial aid has been relatively steady nationally in the last several years.
The SHEEO report looks at the most recently completed fiscal year for colleges and universities -- in this case 2017. Another source, the annual Grapevine survey, is an early look at states’ funding for higher education in the current fiscal year. The latest Grapevine survey, released in January, showed state fiscal support for higher education growing by only 1.6 percent in 2018.