You have /5 articles left.
Sign up for a free account or log in.
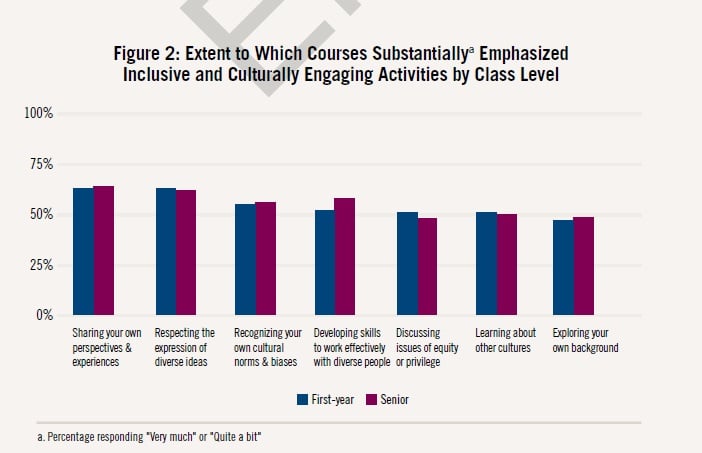
College students report that their classes emphasize them sharing their own ideas and perspectives, and that they’re not always learning about other cultures, according to findings by the National Survey of Student Engagement released Thursday.
About three out of five students surveyed indicated that their courses would highlight their thoughts on certain subjects -- about half said their classes focused on discussing equity and privilege and learning about other cultures.
This doesn’t mean that instructors should turn the curriculum over to their students, said Alexander McCormick, NSSE director, but rather professors -- to some degree of success -- are helping students link subject matter back to the students’ experiences.
“No doubt it can be somewhat uncomfortable for some academics to acknowledge that students are bringing perspectives that help bear on the educational experience, but it’s also important not to take that too far,” McCormick said.
While a total of about 650 four-year U.S. colleges and universities and 75 Canadian institutions participated in the survey, they did not have to administer every part of it to their students. More than 55,000 students across more than 130 institutions answered questions about cultural diversity.
This year, NSSE intentionally focused on capturing data about diversity and inclusion, in light of the national political climate, McCormick said. He said that movements like Black Lives Matter remain prominent, as do controversial legislative measures such as so-called bathroom bills introduced that limit where transgender men and women can use the restroom.
Previously, too, institutions had to opt to include a question about students’ sexual orientation -- this year NSSE decided to simply add it in, McCormick said.
Administrators can use the data as a “jumping-off point” to discuss these sorts of issues on their campuses, he said.
McCormick said the findings around students being able to express their perspectives is heartening, and that, naturally, certain disciplines would emphasize those principles over another. Engineering majors, for instance, wouldn’t be taking as many classes that center on diversity -- but “that doesn’t let institutions off the hook,” McCormick said.
More frequently, companies hiring those engineers are seeking employees who can interact with different groups of people and understand the needs of their clients, he said.
The counterpart faculty survey to NSSE, the Faculty Survey of Student Engagement, found that professors teaching education, social services and arts and humanities classes emphasized “inclusive and culturally engaging activities” more than other fields.
In the NSSE, about 60 percent of students surveyed for the diversity portion indicated that their classes respected “expression of diverse ideas.” And a little more than 50 percent said the classes helped them recognize cultural norms and their own biases.
Not all academics agree with NSSE's methods or positions.
Peter Wood, president of the National Association of Scholars, said that NSSE from its inception has been an "agenda-driven" instrument. It has conflated academic "quality" with elements of the student experience that are separate from teaching substantive material, he said.
Over the years, "student engagement" has been blurred farther away from academics, and this year NSSE reached "a new nadir" by focusing on inclusiveness and diversity, Wood said.
"These are ideological positions that have nothing to do with the quality of education and everything to do with conformity to identitarian politics. A curriculum that emphasizes students 'sharing their own perspectives and experiences' is a curriculum that elevates feelings and intuitions over disciplined inquiry," Wood said via email.
Student Activism
Over the past several years, and particularly since the election of President Trump, students have more vigorously lobbied their administrators and presidents and launched campus rallies around social justice issues.
A small portion of students on the NSSE, about 6,000 from 26 institutions, were asked about social and political activism -- the survey considered a student an activist if they had participated in some sort of boycott, strike, sit-in or walkout. About one in eight students said they were involved in that kind of activity.
The survey found that more of the students NSSE deemed activists were of the traditional college age (late teens into early 20s) and lived on campus.
About 38 percent of activists were students of color, compared to 28 percent of nonactivists, and 23 percent labeled themselves lesbian, gay, bisexual, transgender or queer, versus 8 percent of nonactivists.
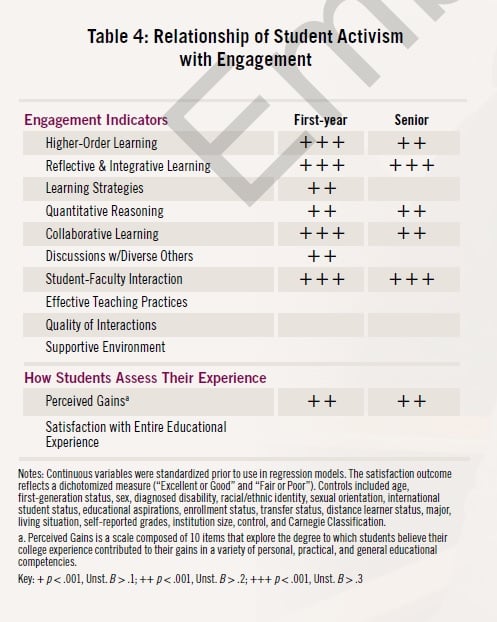 Activist students had a slew of positive characteristics associated with them, according to the survey results -- the students felt they had stronger relationships with faculty members and engaged in a number of positive learning strategies.
McCormick, the NSSE director, said that while college presidents in the past have been pressured by some alumni to “punish” activists who seemingly disrupt the campus environment, he said in actuality, the data suggest that these are the types of students institutions should try to recruit.
“They’re not just rabble-rousers, cutting class to make mischief,” he said. “In the aggregate, we find these students to be having positive educational experiences and engaging in their role as students.”
Wood, meanwhile, said that students should avoid colleges that prioritize "civic engagement."
More and more, Wood said, colleges are swapping out true intellectual teachings for progressive activism and labeling it civic engagement. Wood's association published a report on this phenomenon earlier this year, "Making Citizens."
First-Generation College Students Still Struggle
The NSSE confirmed that first-generation college students in many instances participated in certain opportunities, such as studying abroad, to a lesser degree than other students.
About 8 percent of senior first-generation students in the survey sample studied abroad, compared to 18 percent of non-first-generation seniors. About 42 of first-generation seniors secured an internship, compared to 55 percent of those seniors who were not first generation.
“I think this is important and meaningful to institutions in investigating to what extent is money an obstacle to participating in some of these activities,” McCormick said.
Other Findings
- NSSE determined the most popular majors among senior students by gender. For men, it was business, at 21 percent. For women, it was a major in a health profession, 19 percent. Arts and humanities were popular among students who identified by a gender other than male or female -- for instance, nonbinary -- at 22 percent.
- While many LGBTQ students (80 percent), both first-year students and seniors, were acquainted with another LGBTQ student, far fewer knew a queer faculty member -- 30 percent of first-year students said they knew a gay faculty member, and 50 percent of seniors did.
- Students who had positive interactions with faculty indicated they were more likely to return to the same institution if they could have a "do over." Those who had a quality interaction with a professor -- about 60 percent -- also mostly indicated they would "definitely return" to that college (50 percent).