You have /5 articles left.
Sign up for a free account or log in.
First-time graduate student enrollments were up 3.9 percent last fall from a year earlier, according to a new report from the Council of Graduate Schools. Each of the last four annual surveys has found that enrollment has increased, but 2015’s bump was one of the biggest since 2009. Contributing to that growth was an increase in the share of underrepresented minority student enrollees, which could be a response to national conversations and institutional initiatives on faculty diversity. At the very least, it’s a possible start to broadening the eventual faculty applicant pool.
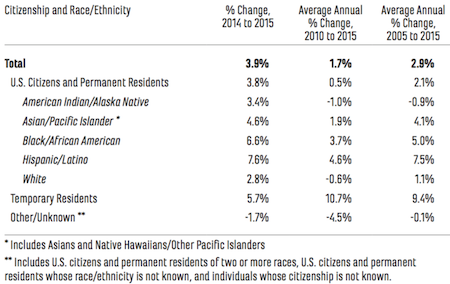
“This year’s data are very encouraging in terms of underrepresented minorities seeing very robust growth in their first-time graduate enrollment -- nonwhite Hispanics are up by 7.6 percent [year over year] and African-Americans are up 6.6 percent,” compared to a 2.8 percent increase among whites, said Hironao Okahana, assistant vice president for research and policy analysis at the council and one of the report’s authors.
“There’s still a way to go in terms of their actual numbers,” Okahana said, noting that minority representation within the student body is still relatively low compared to the general population. “But we do think part of this growth comes from how many graduate institutions are working very hard to recruit and retain and help minority students succeed.”
First-Time Graduate Enrollment by Citizenship and Race/Ethnicity, 2005-15
The council doesn’t disaggregate its data on race and ethnicity to show whether enrollments are in master’s or doctoral programs, so it’s too early to tell how many underrepresented minority students will seek their Ph.D.s -- let alone to become faculty members. The vast majority of the enrollments over all last year -- some 83.6 percent -- were in programs leading to master’s degrees or graduate certificates.
Still, at least 22.5 percent of American and permanent U.S. resident first-time graduate students were underrepresented minorities in fall 2015, including American Indian/Alaska Native (0.5 percent), African-American (11.8 percent), native Hawaiian/other Pacific Islander (0.2 percent) and Latino (10 percent). Underrepresented-minority women saw particularly big gains in enrollment.
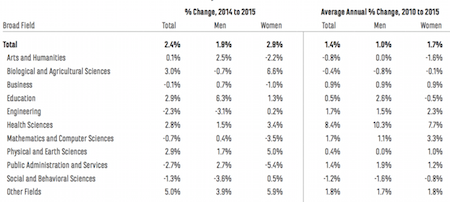
In another trend, new arts and humanities doctoral enrollments were up slightly (0.1 percent) last year from 2014, but not enough to put a dent in a five-year-average enrollment decline of 0.8 percent. New doctoral enrollments in the social and behavioral sciences have declined year over year and over five years by more than 1 percent, as well.
Okahana said the longer-term downward trend could be a response to a shaky academic job market in the humanities. “It’s one thing that could be weighing on a potential applicant’s mind.” At the same time, he said, council member institutions and other groups are working with graduate students to broaden their skill sets and help them “think outside the box” about potential nonfaculty careers. One example of many such programs, which Okahana highlighted, is the National Endowment for the Humanities’ Next Generation Ph.D. Implementation Grants to transform scholarly preparation in the humanities at the doctoral level.
First-Time Doctoral Enrollment by Field and Gender, 2014-15 and 2010-15
Rosemary Feal, executive director of the Modern Language Association, said there’s been a “longstanding and vigorous discussion about the right size of doctoral programs, with much of the argument focused on the equally longstanding decline in the number of tenure-track positions as compared to the number of Ph.D.s who seek those positions.” So enrollment data can reflect “responsible decisions” that graduate programs make to reduce the size of entering classes, as well as decisions students make about whether to apply, Feal said.
Anecdotally, Feal said she’s heard departments describe the “advantages that can follow from limiting the size of entering cohorts,” especially when resources can be spread among fewer students, such as to increase support packages or offer more intangible forms of support.
Over all, applications to doctoral programs decreased by 4.3 percent last year compared to 2014. They increased by 3.8 percent for master’s and other programs. At the master’s level, math and computer science saw the biggest one-year increase in applications, of 11.2 percent.
Engineering, business and health sciences admissions offices were the busiest, seeing 39.3 percent of all applications for 2015. The largest share of doctoral-level applications was in the social and behavioral sciences, at 18.7 percent of all applications reported. These sciences also were highly competitive for admissions, with an acceptance rate of 14.7 percent (only business was lower, at 13.4 percent).
Education doctoral programs saw the largest one-year increase in applications of all broad fields. At the master’s level, math and computer science saw a whopping 11.2 percent jump.
Women made up the majority of first-time students, at 58.2 percent of master’s and certificate-level students and 51.3 percent at the Ph.D. level. According to the survey, women earned 66.4 percent of graduate certificates in 2014-15, 58.4 percent of the master’s degrees and 51.8 percent of doctorates. Among first-time enrollees last year, men were more likely to be enrolled full time than women.
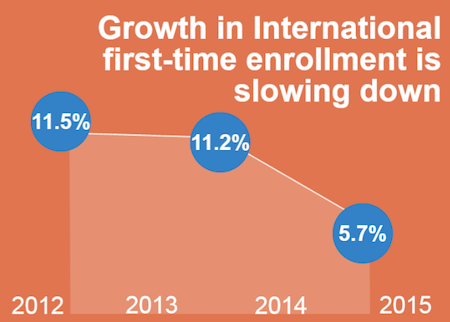
Much graduate school application growth has been led in recent years by international students. First-time international student enrollment continued to climb this year over last, by 5.7 percent, but it was considerably lower than recent increases. Okahana said it’s too early to tell whether it’s a single-year blip or the beginning of a downward trend, and noted that earlier growth was probably unsustainable -- at least in terms of the annual survey.
International students still made up 22 percent of first-time enrollees in graduate school. At research universities with high research activity, about three in 10 were temporary residents. The share of international students among all enrollees was particularly high in math and computer science, at 63.2 percent, and engineering, at 58.5 percent.