You have /5 articles left.
Sign up for a free account or log in.
First-time graduate school enrollment was up 3.5 percent in 2014 from the year before, the biggest annual increase since 2009, according to a report out today from the Council of Graduate Schools.
“I was surprised that that number was as big as it was,” said Jeff Allum, assistant vice president for research and policy analysis for the council and co-author of its “Graduate Enrollment and Degrees: 2004 to 2014” study. “We’ve had several years of very small increases or decreases in enrollment, so 3.5 percent is a very good number for this particular survey.”
Allum said the increase is a combination of “very robust” growth among international students -- up 11.2 percent year over year -- as well as a significant, 1.3 percent jump in enrollment among U.S. citizens.
Over all, last year set records in terms of applications, offers of admission and total first-time enrollment, according to the council’s survey. Responding institutions reported receiving more than 2 million applications, extending places to 850,000 students and enrolling 480,000 first-time students.
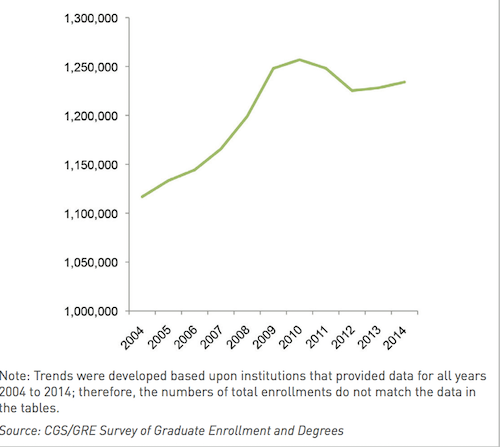
Yet despite these numbers, total graduate enrollment -- meaning the number of students attending graduate school, not just for the first time -- remained below the peak set in 2009, and increased by just 0.4 percent since 2013, according to the study.
Trends in Total Graduate Enrollment, Fall 2004 to 2014
Allum said he acknowledged the importance of overall enrollment numbers, given the ongoing conversations among graduate educators about problematic completion rates. But he said the council in this specific report focused on first-time enrollment because it’s a good predictor of future enrollment.
First-time graduate enrollment grew in six broad fields of study, according to the report. The biggest year-over-year increases were observed in mathematics and computer sciences, at 21.3 percent; engineering, at 10.7 percent; and the health sciences, at 6.1 percent.
The council observed first-time enrollment decreases in five fields, including the arts and humanities, which were down 4 percent. The social and behavioral sciences were down 3.1 percent.
First-time enrollments in master’s level programs increased by 3.7 percent, and by 1.9 percent in doctoral programs.
International students accounted for about two-thirds of the growth in first-time, full-time student enrollment head counts. As in previous years, science, technology, engineering and math (STEM) fields saw particularly high concentrations of these temporary residents.
First-Time Graduate Enrollment by Field of Study and Citizenship, Fall 2014
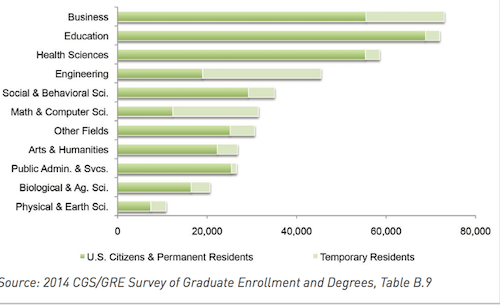
Some 65.9 percent of all temporary resident graduate students were enrolled in STEM or social or behavioral science fields last year. Just 27.1 percent of U.S. graduate students were enrolled in those fields.
Also as in previous years, women continued to enroll in graduate school in larger numbers than men, constituting more than half of first-time students. That’s 57.9 percent of enrollments in master’s degree and certificate-level programs and 51 percent in doctoral degree programs.
While women represented a large majority of enrollments in in several fields, including public administration (77.5 percent) and health sciences (77.1 percent), they were still underrepresented in STEM. Just 25 percent of enrollees in engineering, for example, were women. In mathematics and computer sciences, they were 32.5 percent.
But women may be catching up. The council notes that growth in first-time STEM enrollments by women was generally equivalent to that of men in many fields.
Enrollment among underrepresented minority students remains “uneven,” according to the study. In 2014, 24.2 percent of all first-time graduate students were from racially or ethnically underrepresented populations. Latino students saw a 6.8 percent enrollment increase, while African-American students saw a small gain of 2 percent. There was a 3 percent decline among Native Americans.
The council has partnered with the Graduate Record Examinations Board since 1986 to complete the survey. This year’s survey included responses from 636 college and universities, representing a response rate of 81 percent.
Suzanne T. Ortega, council president, said the annual growth rate was positive, but that the disparity between U.S. and international student enrollment growth is still “a cause for concern.” That’s because the Bureau of Labor Statistics projects that employers will add nearly 2.4 million jobs requiring a graduate or even more advanced degree between 2012 and 2022.
To meet that demand, even higher enrollment rates are needed, she said.
Additional findings include that applications to graduate business programs were up 5.4 percent year over year, although, interestingly, international graduate student enrollment in these programs was down slightly. First-time enrollment in education programs decreased 1.3 percent.
The largest fields by total enrollment were education and business, at 19 percent and 15 percent, respectively, of all graduate students. Some 73.1 percent of all students were enrolled in master’s degree or graduate certificate programs. Responding institutions awarded about 73,000 doctoral degrees, 526,000 master’s degrees and 36,000 graduate degree certificates in 2014.
Women earned nearly two-thirds (65.9 percent) of graduate certificates, 59 percent of master’s degrees and 52.2 percent of doctorates. Last year marked the sixth year in a row in which women earned a majority of doctoral degrees.